> ## Documentation Index
> Fetch the complete documentation index at: https://docs.seersearch.com/llms.txt
> Use this file to discover all available pages before exploring further.
# Alerting
> Get notified when retrieval quality degrades
# Alerting
Get notified when your retrieval quality degrades. Seer's alerting system monitors your metrics and sends webhook notifications when thresholds are breached.
> **Prerequisites:** You have data flowing through Seer (see [Quickstart](/quickstart)) and understand [Metrics](/metrics).
***
## Default Alerts
When you onboard, Seer automatically creates three default alerts:
| Alert | Metric | Threshold | Window |
| ---------------------------- | --------- | --------- | -------- |
| **Quality Drop - Recall** | Recall | -20% drop | 24 hours |
| **Quality Drop - Precision** | Precision | -20% drop | 24 hours |
| **Traffic Drop** | Volume | -50% drop | 24 hours |
These alerts fire when the metric drops by the specified percentage compared to the previous period.
Default alerts are org-wide (all environments) with a 4-hour cooldown. Customize them in the Alerts page.
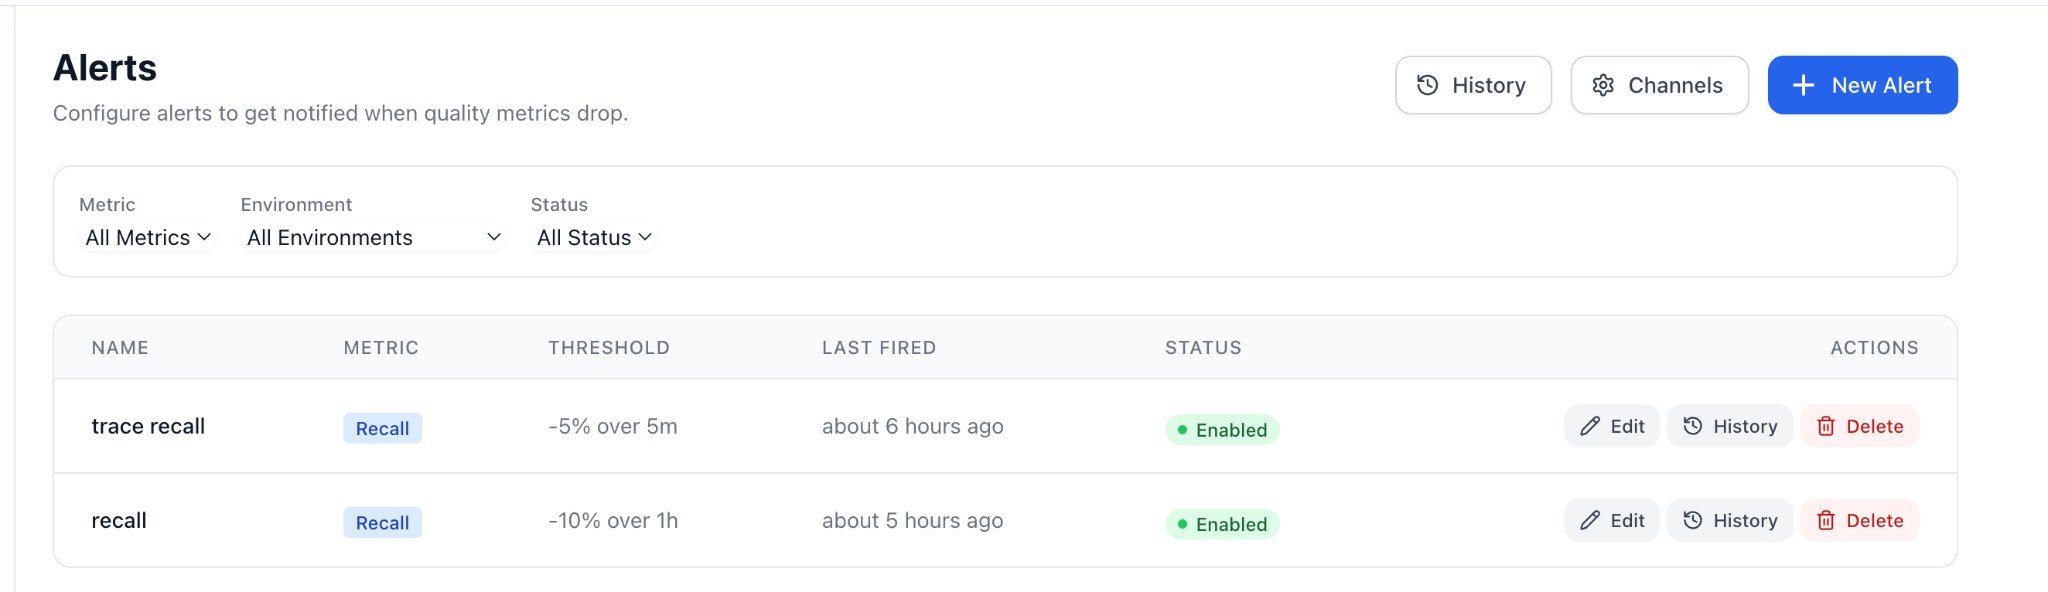 *Alerts page showing configured alerts with metric type, threshold, last fired time, and status.*
***
## Alert Configuration
### Metric Types
| Metric | Description |
| ------------- | ----------------------------------------------- |
| **Recall** | Fraction of requirements covered by context |
| **Precision** | Fraction of documents that support requirements |
| **F1** | Harmonic mean of recall and precision |
| **Volume** | Number of evaluations in the window |
### Threshold Types
| Type | Description | Example |
| ---------------- | ------------------------------------------------ | ----------------- |
| **Percent Drop** | Alert when metric drops by X% vs previous window | `-0.1` = 10% drop |
| **Absolute** | Alert when metric falls below X | `0.7` = below 70% |
### Time Windows
Choose how much data to compare:
| Window | Use Case |
| -------------- | -------------------------- |
| **15 minutes** | Fast detection, more noise |
| **1 hour** | Balanced (recommended) |
| **6 hours** | Smooth out daily patterns |
| **24 hours** | Detect gradual degradation |
### Evaluation Scope
| Scope | Description |
| ---------------------- | ----------------------------------------------------------- |
| **Trace (End-to-End)** | Evaluate based on final context quality for complete traces |
| **Span (Per-Stage)** | Evaluate based on individual retrieval stage quality |
For most use cases, **Trace** is recommended as it reflects the end-user experience.
### Cooldown
Minimum time between repeat alerts (1 minute to 7 days). Prevents alert fatigue during extended incidents.
***
## Creating an Alert
1. Navigate to **Alerts** in the sidebar
2. Click **New Alert**
3. Configure:
* **Name**: Descriptive name (e.g., "Production Recall SLO")
* **Metric**: Which metric to monitor
* **Scope**: Trace or Span level
* **Threshold Type**: Percent drop or absolute
* **Threshold Value**: The trigger point
* **Time Window**: Comparison period
* **Environment**: Specific env or org-wide
* **Cooldown**: Time between alerts
* **Channels**: Where to send notifications
4. Click **Create Alert**
*Alerts page showing configured alerts with metric type, threshold, last fired time, and status.*
***
## Alert Configuration
### Metric Types
| Metric | Description |
| ------------- | ----------------------------------------------- |
| **Recall** | Fraction of requirements covered by context |
| **Precision** | Fraction of documents that support requirements |
| **F1** | Harmonic mean of recall and precision |
| **Volume** | Number of evaluations in the window |
### Threshold Types
| Type | Description | Example |
| ---------------- | ------------------------------------------------ | ----------------- |
| **Percent Drop** | Alert when metric drops by X% vs previous window | `-0.1` = 10% drop |
| **Absolute** | Alert when metric falls below X | `0.7` = below 70% |
### Time Windows
Choose how much data to compare:
| Window | Use Case |
| -------------- | -------------------------- |
| **15 minutes** | Fast detection, more noise |
| **1 hour** | Balanced (recommended) |
| **6 hours** | Smooth out daily patterns |
| **24 hours** | Detect gradual degradation |
### Evaluation Scope
| Scope | Description |
| ---------------------- | ----------------------------------------------------------- |
| **Trace (End-to-End)** | Evaluate based on final context quality for complete traces |
| **Span (Per-Stage)** | Evaluate based on individual retrieval stage quality |
For most use cases, **Trace** is recommended as it reflects the end-user experience.
### Cooldown
Minimum time between repeat alerts (1 minute to 7 days). Prevents alert fatigue during extended incidents.
***
## Creating an Alert
1. Navigate to **Alerts** in the sidebar
2. Click **New Alert**
3. Configure:
* **Name**: Descriptive name (e.g., "Production Recall SLO")
* **Metric**: Which metric to monitor
* **Scope**: Trace or Span level
* **Threshold Type**: Percent drop or absolute
* **Threshold Value**: The trigger point
* **Time Window**: Comparison period
* **Environment**: Specific env or org-wide
* **Cooldown**: Time between alerts
* **Channels**: Where to send notifications
4. Click **Create Alert**
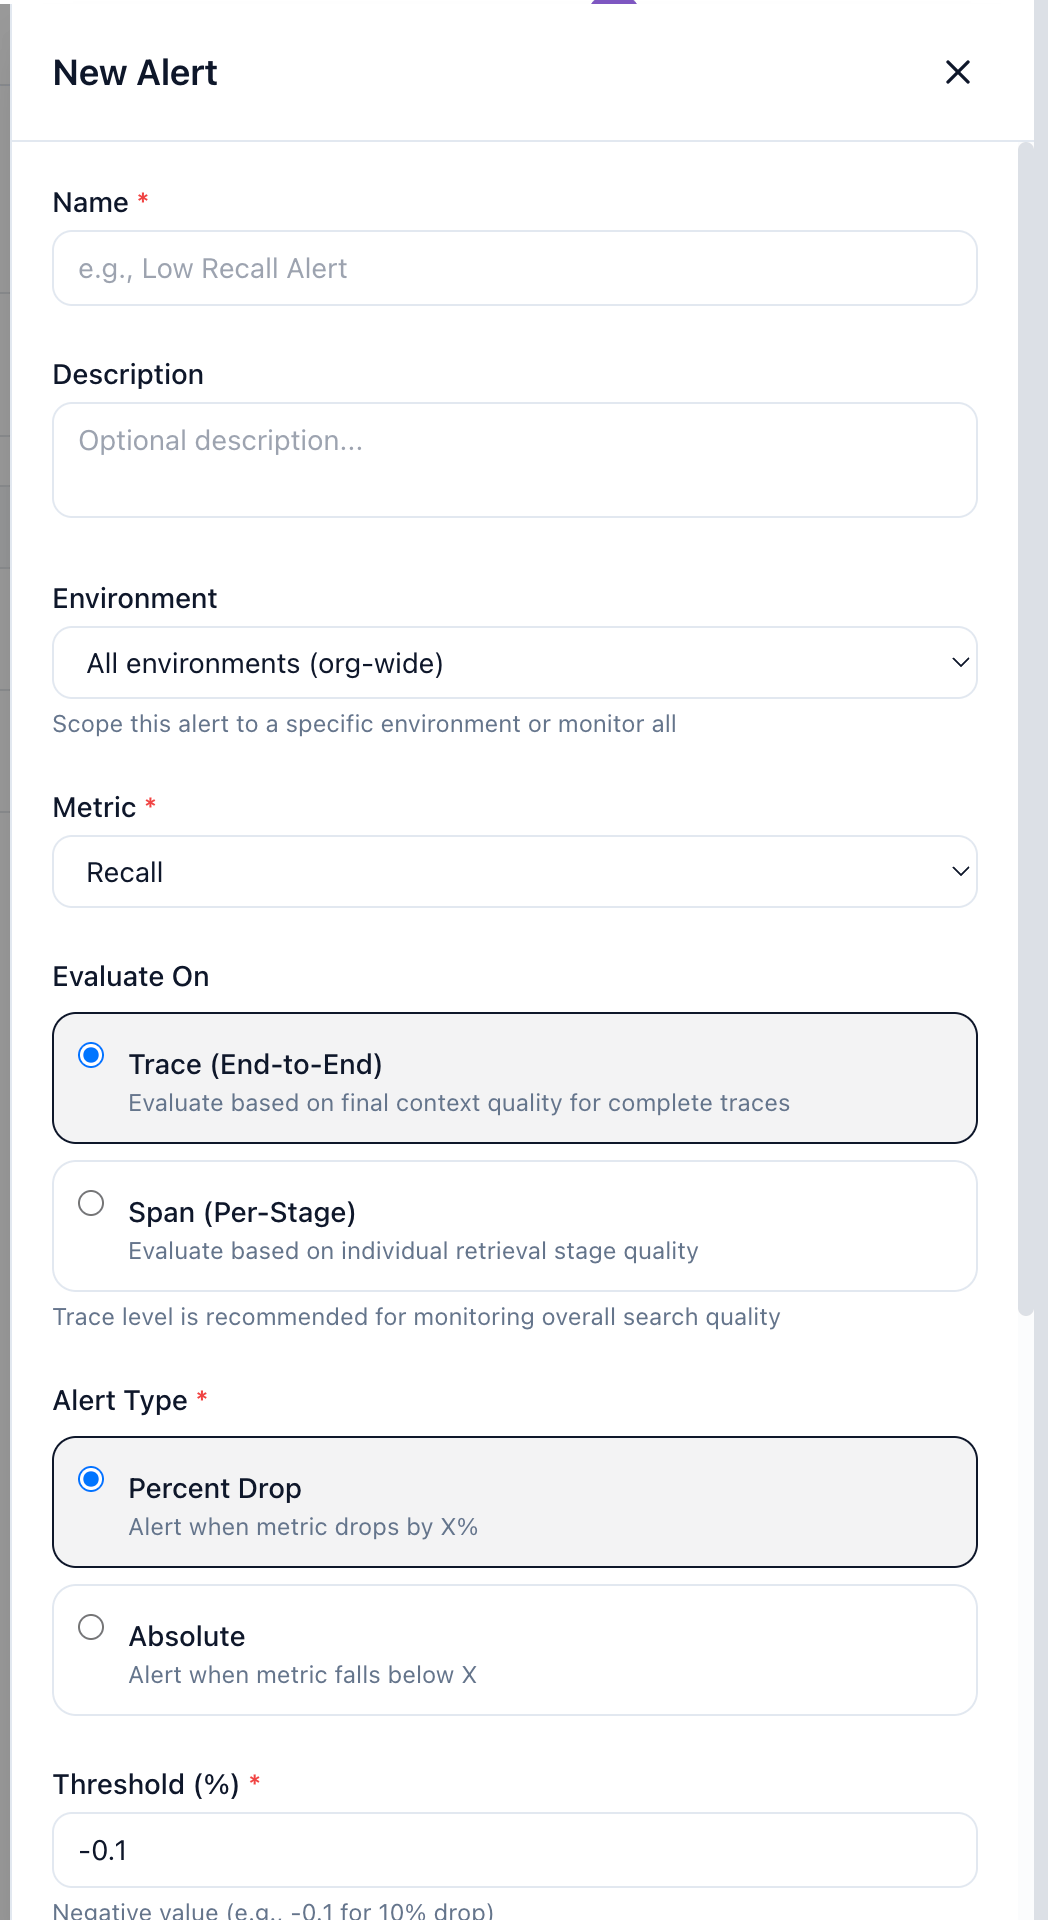 *Alert configuration form with metric selection, evaluation scope (Trace/Span), threshold type, and time window options.*
***
## Notification Channels
Alerts are sent to **webhook** endpoints you configure.
### Setting Up a Webhook Channel
1. Go to **Alerts → Channels**
2. Click **New Channel**
3. Enter:
* **Name**: Descriptive name (e.g., "Slack #alerts")
* **Channel Type**: Webhook, Email, or Slack
* **URL**: Your webhook endpoint
4. Enable the channel
5. Click **Create Channel**
*Alert configuration form with metric selection, evaluation scope (Trace/Span), threshold type, and time window options.*
***
## Notification Channels
Alerts are sent to **webhook** endpoints you configure.
### Setting Up a Webhook Channel
1. Go to **Alerts → Channels**
2. Click **New Channel**
3. Enter:
* **Name**: Descriptive name (e.g., "Slack #alerts")
* **Channel Type**: Webhook, Email, or Slack
* **URL**: Your webhook endpoint
4. Enable the channel
5. Click **Create Channel**
 *Channels page showing configured webhook with status and URL.*
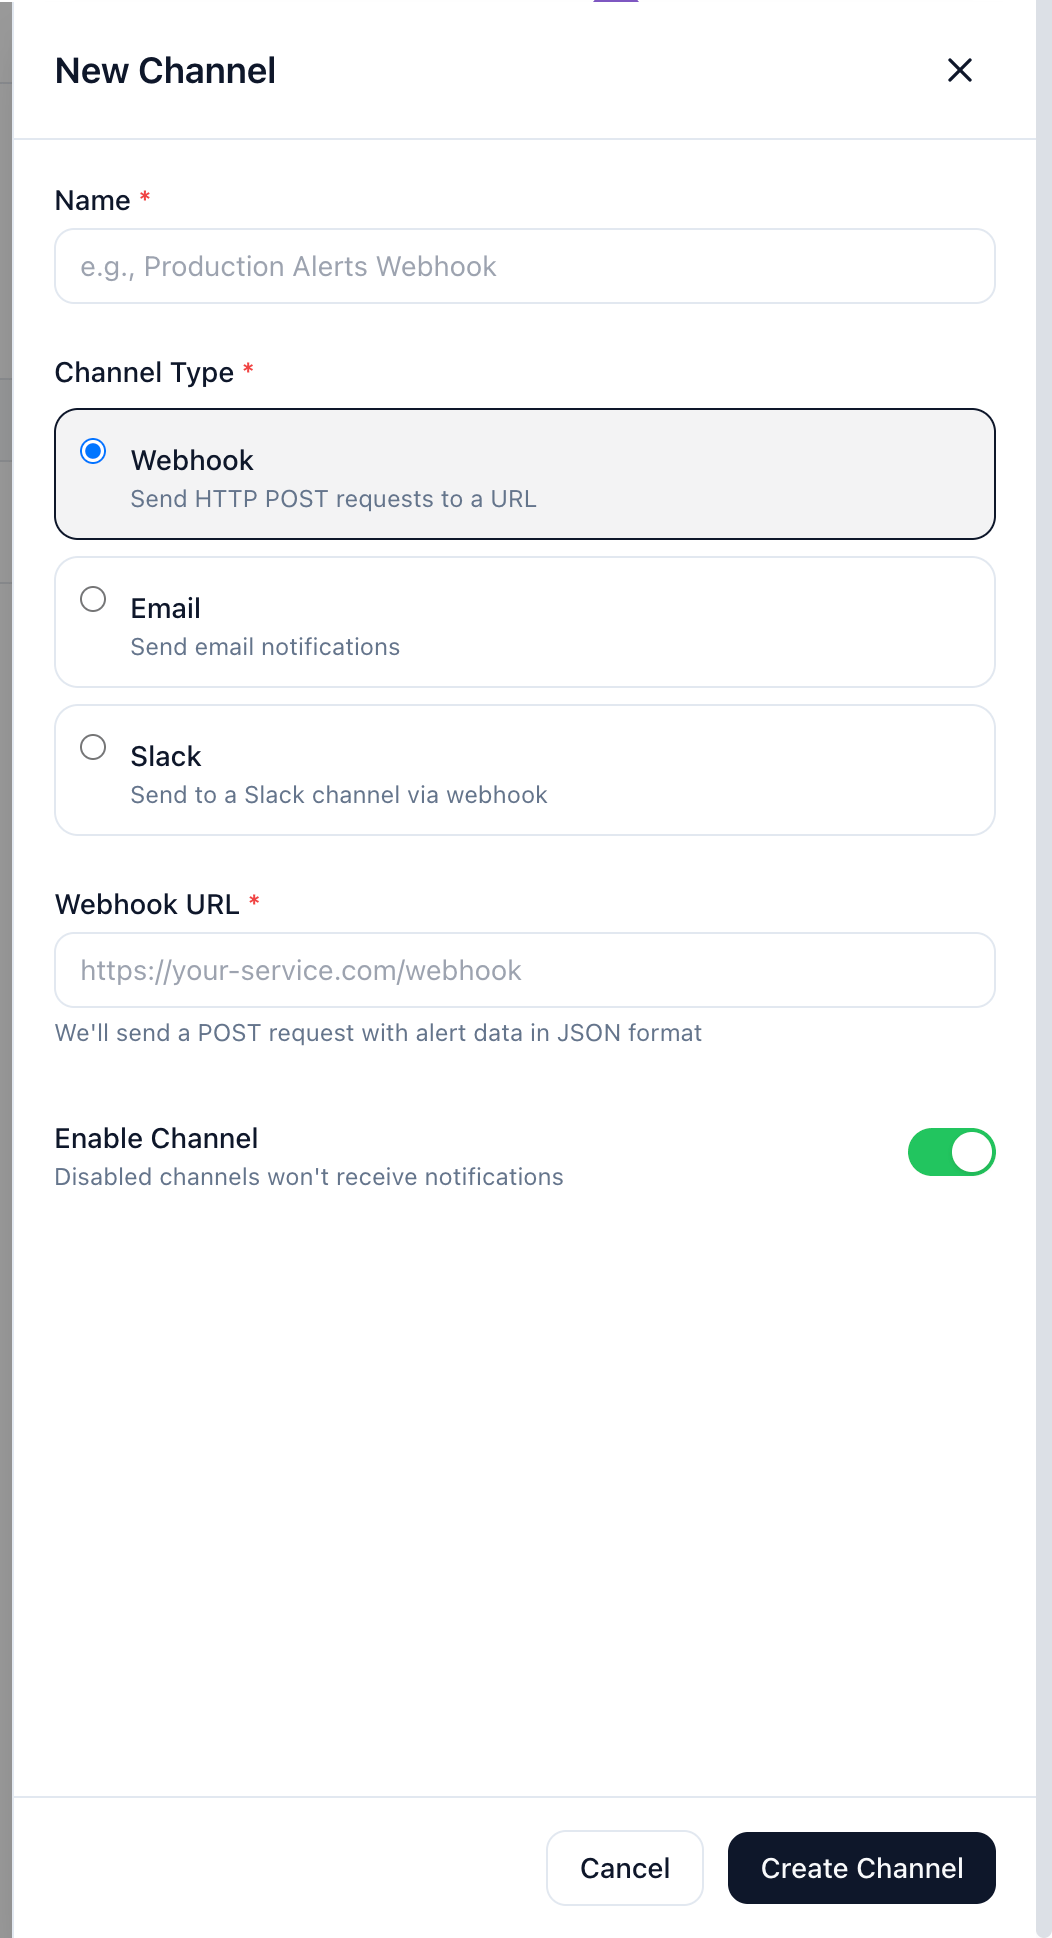 *Channel configuration with Webhook, Email, and Slack options.*
### Webhook Payload
When an alert fires, Seer sends a POST request with this payload:
```json theme={null}
{
"alert_id": "uuid",
"alert_name": "Quality Drop - Recall",
"status": "firing",
"metric_type": "recall",
"threshold_type": "percent_drop",
"threshold": -0.2,
"current_value": 0.65,
"previous_value": 0.82,
"change_percent": -0.207,
"fired_at": "2025-01-01T12:00:00Z",
"org_id": "uuid",
"env_id": "uuid",
"dashboard_url": "https://app.seersearch.com/monitoring"
}
```
### Slack Integration
Use Slack's [Incoming Webhooks](https://api.slack.com/messaging/webhooks) to send alerts to a channel:
1. Create an Incoming Webhook in Slack
2. Add the webhook URL as a Seer channel
3. Link the channel to your alerts
### PagerDuty Integration
Use PagerDuty's [Events API](https://developer.pagerduty.com/docs/events-api-v2/overview/):
1. Create a PagerDuty service with Events API integration
2. Use the integration URL as your Seer webhook
3. Map the payload fields to PagerDuty's format via a middleware (e.g., AWS Lambda, Zapier)
***
## Alert History
View past alerts in **Alerts → History**:
* **Status**: Firing or resolved
* **Timestamp**: When the alert fired
* **Metric values**: Current and previous values
* **Change percent**: How much the metric changed
Filter by alert rule or status to find specific events.
*Channel configuration with Webhook, Email, and Slack options.*
### Webhook Payload
When an alert fires, Seer sends a POST request with this payload:
```json theme={null}
{
"alert_id": "uuid",
"alert_name": "Quality Drop - Recall",
"status": "firing",
"metric_type": "recall",
"threshold_type": "percent_drop",
"threshold": -0.2,
"current_value": 0.65,
"previous_value": 0.82,
"change_percent": -0.207,
"fired_at": "2025-01-01T12:00:00Z",
"org_id": "uuid",
"env_id": "uuid",
"dashboard_url": "https://app.seersearch.com/monitoring"
}
```
### Slack Integration
Use Slack's [Incoming Webhooks](https://api.slack.com/messaging/webhooks) to send alerts to a channel:
1. Create an Incoming Webhook in Slack
2. Add the webhook URL as a Seer channel
3. Link the channel to your alerts
### PagerDuty Integration
Use PagerDuty's [Events API](https://developer.pagerduty.com/docs/events-api-v2/overview/):
1. Create a PagerDuty service with Events API integration
2. Use the integration URL as your Seer webhook
3. Map the payload fields to PagerDuty's format via a middleware (e.g., AWS Lambda, Zapier)
***
## Alert History
View past alerts in **Alerts → History**:
* **Status**: Firing or resolved
* **Timestamp**: When the alert fired
* **Metric values**: Current and previous values
* **Change percent**: How much the metric changed
Filter by alert rule or status to find specific events.
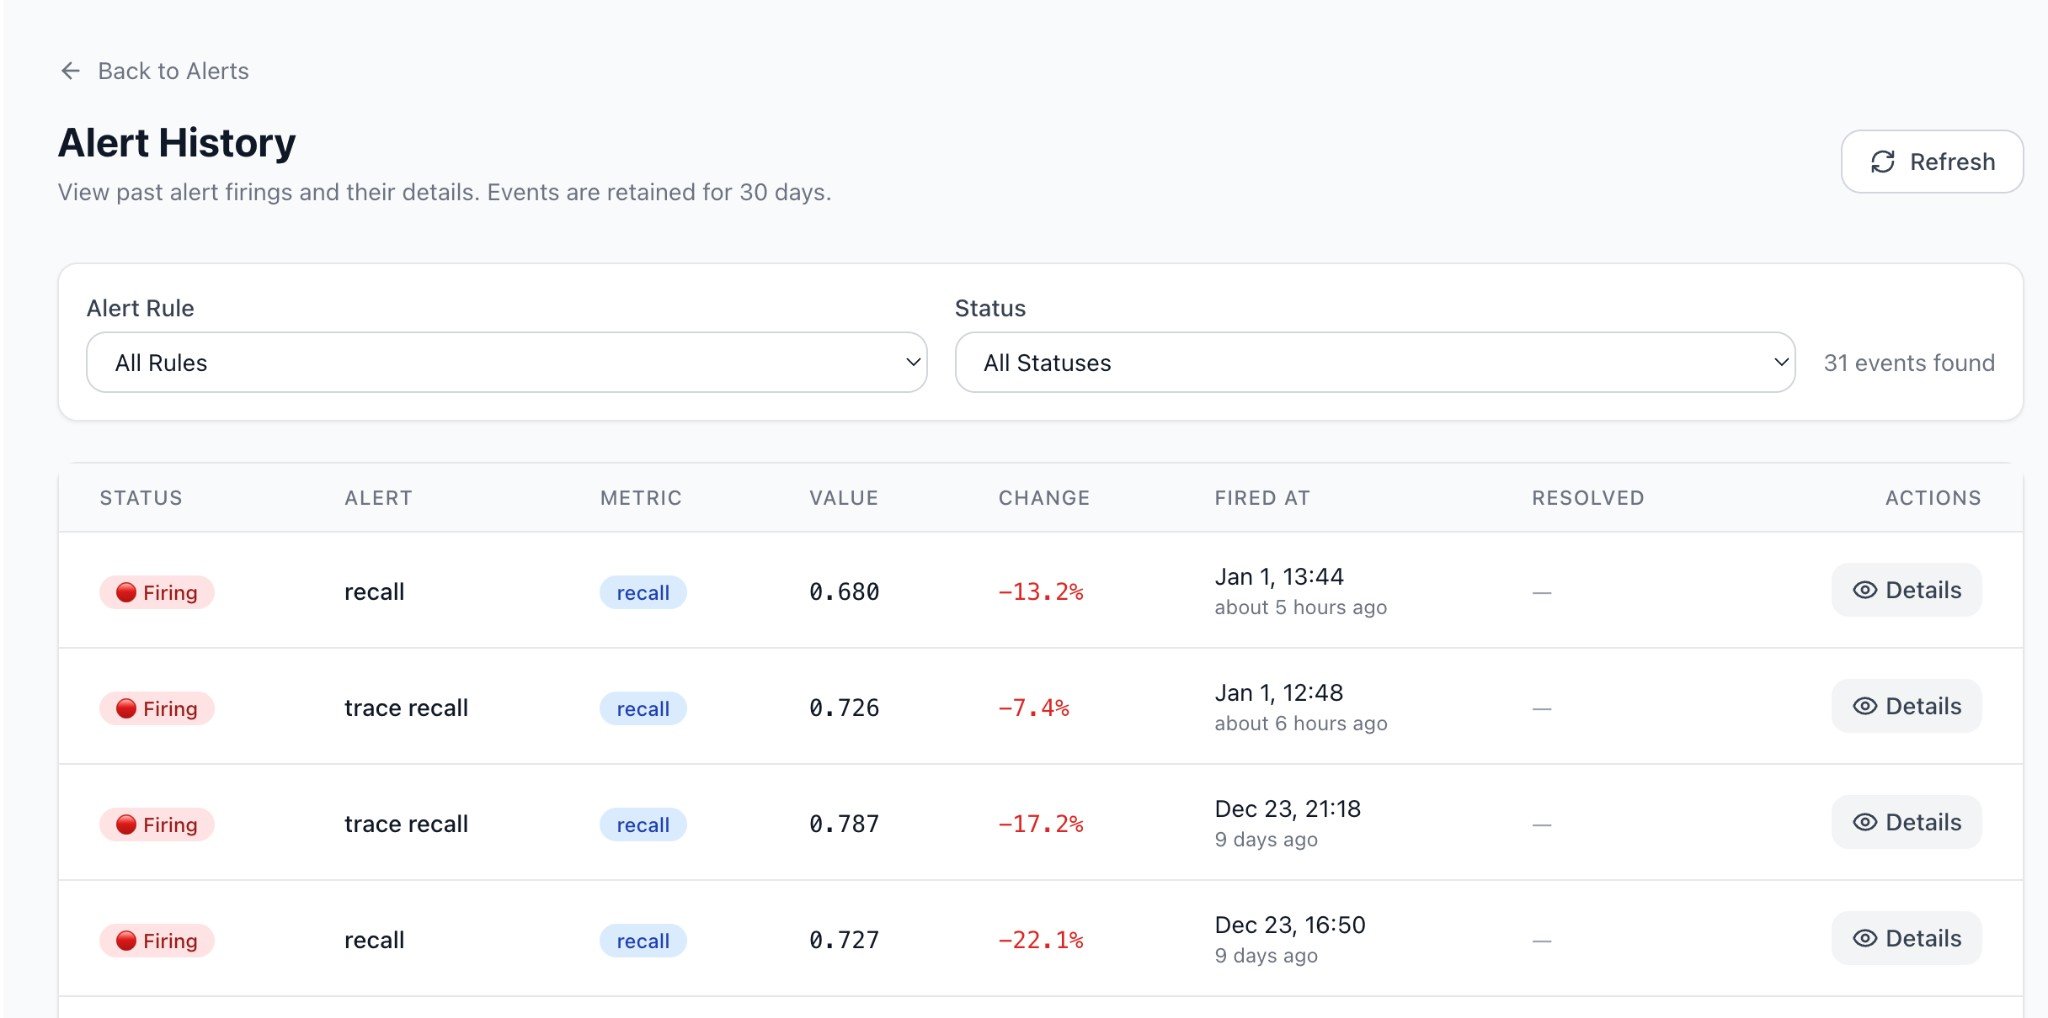 *Alert History showing past firings with status, metric values, change percentage, and timestamps.*
***
## Best Practices
### 1. Start with Defaults
The default alerts catch major regressions. Tune thresholds after observing your baseline.
### 2. Use Environment Scoping
Create separate alerts for prod vs staging:
```
prod: Recall < 70% absolute (critical)
staging: Recall -30% drop (warning)
```
### 3. Set Appropriate Cooldowns
* **Critical alerts**: 15-60 minutes (fast escalation)
* **Warning alerts**: 4-24 hours (reduce noise)
### 4. Test Your Webhooks
Use a service like [webhook.site](https://webhook.site) to test before connecting to Slack/PagerDuty.
***
## Coming Soon
* **Metadata filtering** (alert on specific `feature_flag` values)
* **Resolved notifications** (when metrics recover)
* **Richer Slack formatting** (interactive messages with action buttons)
***
## See Also
* [Metrics](/metrics)
* [Production Monitoring](/production-monitoring)
* [Change Testing](/change-testing)
*Alert History showing past firings with status, metric values, change percentage, and timestamps.*
***
## Best Practices
### 1. Start with Defaults
The default alerts catch major regressions. Tune thresholds after observing your baseline.
### 2. Use Environment Scoping
Create separate alerts for prod vs staging:
```
prod: Recall < 70% absolute (critical)
staging: Recall -30% drop (warning)
```
### 3. Set Appropriate Cooldowns
* **Critical alerts**: 15-60 minutes (fast escalation)
* **Warning alerts**: 4-24 hours (reduce noise)
### 4. Test Your Webhooks
Use a service like [webhook.site](https://webhook.site) to test before connecting to Slack/PagerDuty.
***
## Coming Soon
* **Metadata filtering** (alert on specific `feature_flag` values)
* **Resolved notifications** (when metrics recover)
* **Richer Slack formatting** (interactive messages with action buttons)
***
## See Also
* [Metrics](/metrics)
* [Production Monitoring](/production-monitoring)
* [Change Testing](/change-testing)