> ## Documentation Index
> Fetch the complete documentation index at: https://docs.seersearch.com/llms.txt
> Use this file to discover all available pages before exploring further.
# Logs Explorer
> Inspect individual retrieval events and traces
# Logs Explorer
Drill into individual queries to understand exactly what happened: which documents were retrieved, how Seer scored them, and why quality metrics are what they are.
> **Prerequisites:** You have data flowing through Seer (see [Quickstart](/quickstart)) and understand [Metrics](/metrics).
***
## Why Use Logs?
Aggregate dashboards show trends, but logs answer the hard questions:
| Question | Answer in Logs |
| ------------------------------- | ------------------------------------------------------------------------------ |
| **Why did this query fail?** | See exactly which documents were retrieved and why they were marked irrelevant |
| **Which document is missing?** | Ground truth validation shows which gold docs weren't retrieved |
| **How did multi-hop perform?** | Trace view shows recall progression across each hop |
| **What did Seer actually see?** | Full context passages with relevance labels and scores |
***
## Two View Modes
The Logs page offers two ways to explore your data:
### Traces View (Default)
Best for **multi-hop RAG** and understanding end-to-end query flows.
* Groups related spans by `trace_id`
* Shows the complete journey from query → retrieval → answer
* Displays **final context metrics** (what actually went to the LLM)
* Expandable tree visualization of span hierarchy
### Records View
Best for **individual record inspection** and debugging specific retrievals.
* Shows each evaluation as a single row
* Quick access to all metrics (recall, precision, F1, latency)
* Click any row to open the detail drawer
- Use **Traces** when debugging why a multi-step query failed
- Use **Records** when scanning for low-performing individual retrievals
*Traces view with an expanded multi-hop trace showing the span tree, metrics per hop, and final context marker.*
***
## Filtering & Search
Find specific queries quickly using the filter toolbar:
| Filter | Options |
| --------------- | --------------------------------------------- |
| **Search** | Free-text search across task/query content |
| **Status** | All, Succeeded only, Failed only |
| **Quality** | All, Excellent, Good, Fair, Poor |
| **Environment** | Filter by your environment (dev/staging/prod) |
Filters work across both Traces and Records views.
***
## Traces View Deep Dive
### Trace Table Columns
| Column | Description |
| ---------------- | --------------------------------------------------------- |
| **When** | Timestamp of the first span in the trace |
| **Query / Task** | The original user query |
| **Spans** | Number of spans (retrieval hops) in the trace |
| **Overall** | Final recall against the main question (toggle Final/Avg) |
| **Subquery** | Per-hop recall against hop-specific queries |
| **Depth** | Maximum nesting depth of the trace tree |
| **Latency** | Total end-to-end latency |
| **Quality** | Quality grade based on final recall |
### Metric Mode Toggle
Switch between two views of the Overall metric:
* **Final**: Recall of the final context that was passed to the LLM
* **Avg**: Average recall across all spans in the trace
For most debugging, Final is what matters. It's what the user actually experienced.
### Expanding a Trace
Click any trace row to expand and see its spans in a tree structure:
* **Tree lines** show parent-child relationships
* **Span badges** indicate type (retrieval, rerank, llm\_call, etc.)
* **Final context badge** marks which span's context was used for the answer
* **Delta indicators** show how each hop changed overall recall
 ### Trace Detail Sidebar
Click the **View** button on any trace to open the full trace sidebar:
| Section | What You See |
| --------------------------- | ----------------------------------------------------- |
| **Task / Question** | Original query with trace ID and span count |
| **Final Answer Quality** | Recall, precision, F1, nDCG with visual bars |
| **Journey Timeline** | Recall progression chart + timeline of each hop |
| **Ground Truth Validation** | GT recall/precision if gold docs were provided |
| **Performance Breakdown** | Total latency, average per hop, slowest/fastest spans |
### Trace Detail Sidebar
Click the **View** button on any trace to open the full trace sidebar:
| Section | What You See |
| --------------------------- | ----------------------------------------------------- |
| **Task / Question** | Original query with trace ID and span count |
| **Final Answer Quality** | Recall, precision, F1, nDCG with visual bars |
| **Journey Timeline** | Recall progression chart + timeline of each hop |
| **Ground Truth Validation** | GT recall/precision if gold docs were provided |
| **Performance Breakdown** | Total latency, average per hop, slowest/fastest spans |
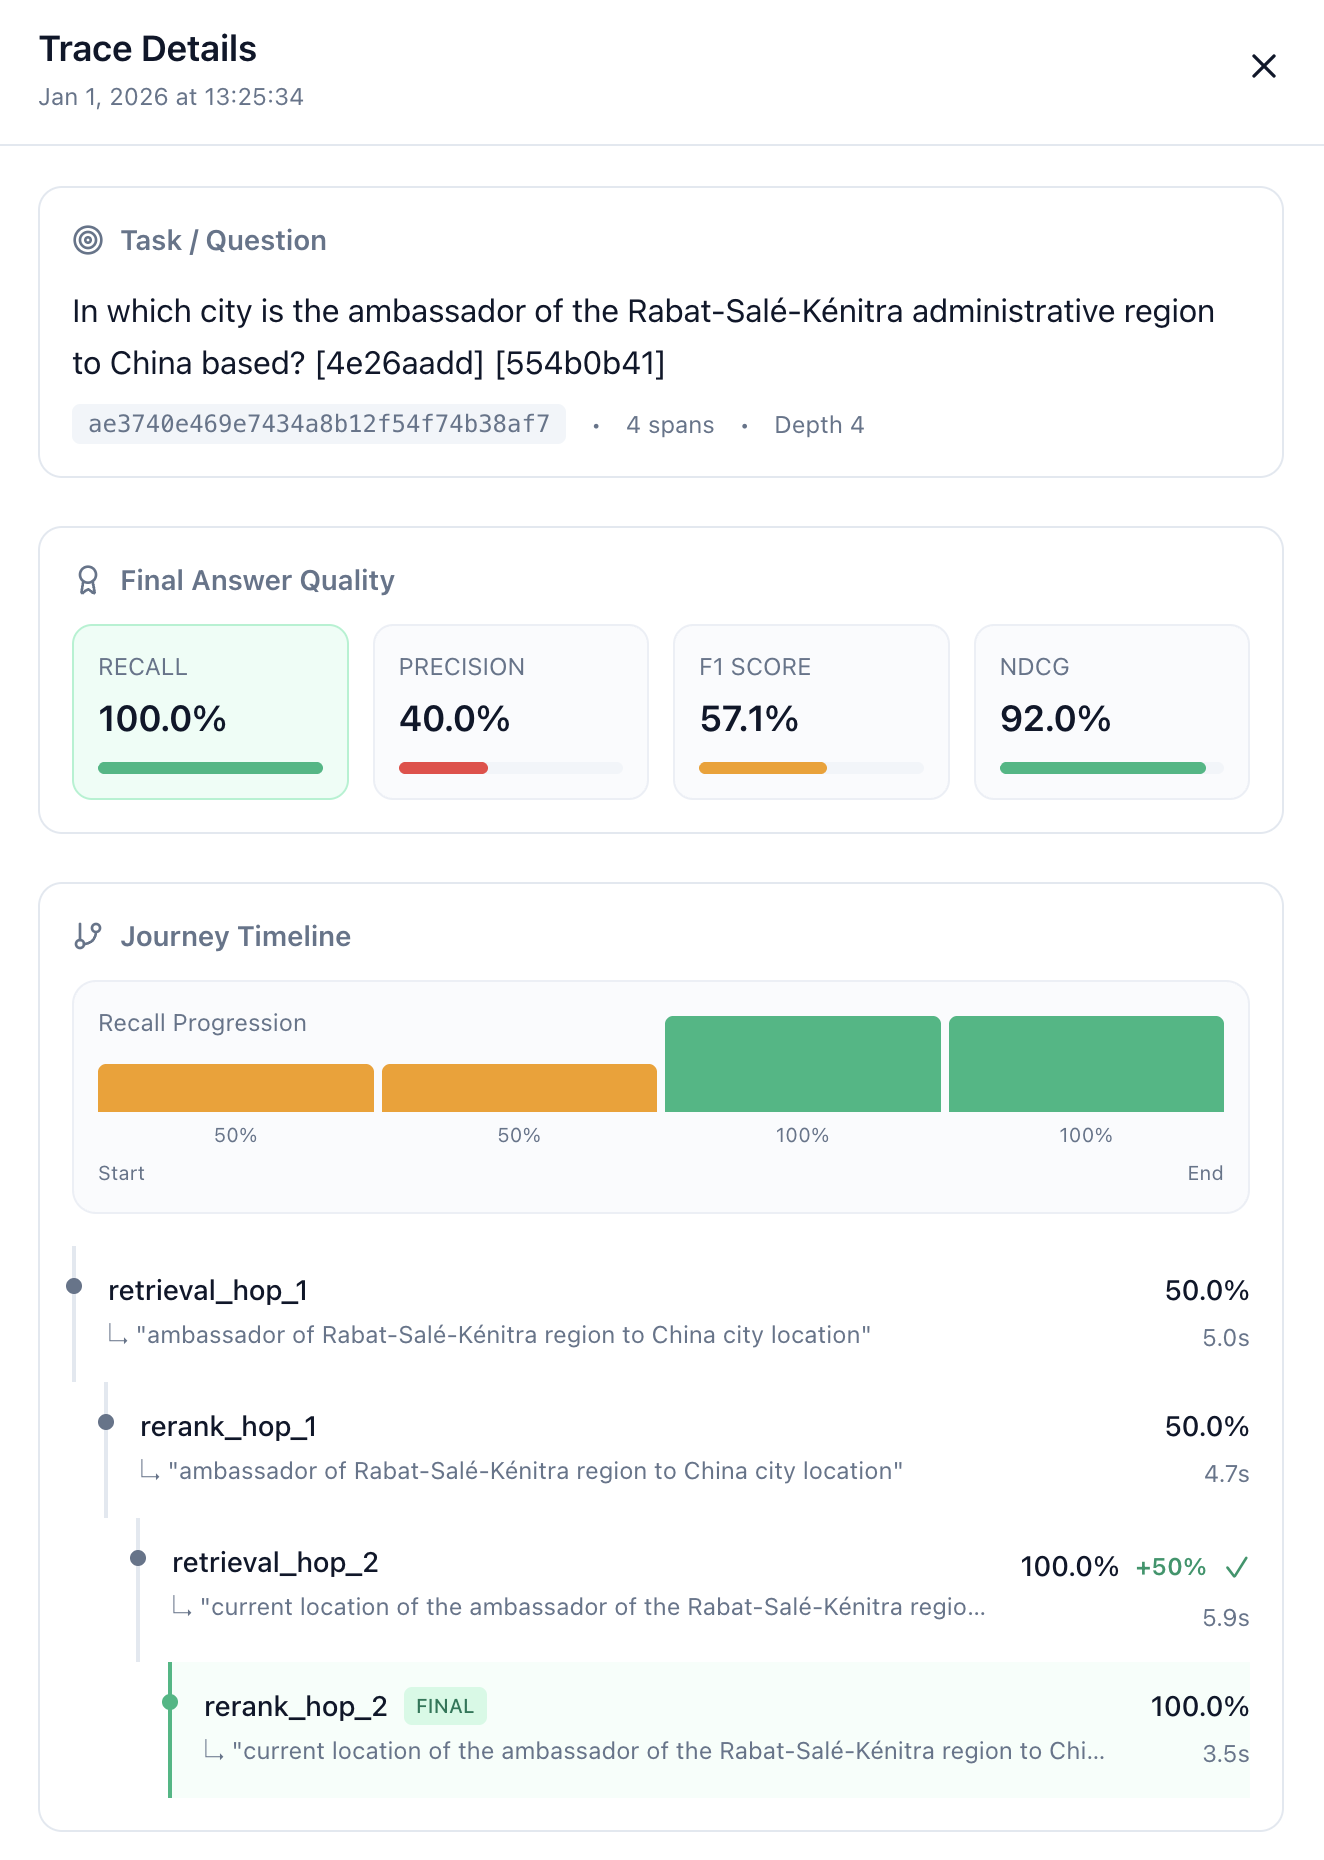 *Trace Detail Sidebar with Final Answer Quality metrics and Journey Timeline showing recall progression from 50% → 100% across hops.*
***
## Records View Deep Dive
### Records Table Columns
| Column | Description |
| ------------------- | --------------------------------------------- |
| **When** | Timestamp of the record |
| **Task / Question** | The query that was evaluated |
| **Recall** | Fraction of requirements covered |
| **Precision** | Fraction of documents supporting requirements |
| **F1** | Harmonic mean of recall and precision |
| **Latency** | Seer evaluation latency |
| **Quality** | Grade (Excellent/Good/Fair/Poor) |
### Sorting
Click any column header to sort:
* First click: ascending
* Second click: descending
* Third click: return to default (newest first)
***
## Record Detail Drawer
Click any record (in either view) to open the detail drawer:
### Sections
| Section | Contents |
| ------------------------------------ | --------------------------------------------------- |
| **Task / Question** | The original query text |
| **Subquery** (multi-hop) | The hop-specific query if part of a trace |
| **Evaluation Metrics** | Recall, precision, F1, nDCG, latency, quality grade |
| **Overall Contribution** (multi-hop) | How this hop contributed to the final answer |
| **Ground Truth** | GT recall/precision if gold docs were provided |
| **Context Passages** | All retrieved documents with relevance labels |
| **Seer Evaluation Output** | The raw XML output from Seer's evaluator |
| **Trace Info** | Trace ID and span ID for correlation |
### Passage Visualization
Each passage in the context shows:
* **Position** and **ID** (e.g., `#1 • ID: doc-123`)
* **Gold badge** if this doc is in ground truth
* **Relevant badge** if Seer marked it as supporting requirements
* **Score** from your retriever
* **Full text** of the passage
* **Source** if provided
Color coding:
* **Green border**: Relevant passage (correctly retrieved)
* **Yellow border**: Gold doc not marked relevant (missed)
* **Gray border**: Not relevant, not gold
*Trace Detail Sidebar with Final Answer Quality metrics and Journey Timeline showing recall progression from 50% → 100% across hops.*
***
## Records View Deep Dive
### Records Table Columns
| Column | Description |
| ------------------- | --------------------------------------------- |
| **When** | Timestamp of the record |
| **Task / Question** | The query that was evaluated |
| **Recall** | Fraction of requirements covered |
| **Precision** | Fraction of documents supporting requirements |
| **F1** | Harmonic mean of recall and precision |
| **Latency** | Seer evaluation latency |
| **Quality** | Grade (Excellent/Good/Fair/Poor) |
### Sorting
Click any column header to sort:
* First click: ascending
* Second click: descending
* Third click: return to default (newest first)
***
## Record Detail Drawer
Click any record (in either view) to open the detail drawer:
### Sections
| Section | Contents |
| ------------------------------------ | --------------------------------------------------- |
| **Task / Question** | The original query text |
| **Subquery** (multi-hop) | The hop-specific query if part of a trace |
| **Evaluation Metrics** | Recall, precision, F1, nDCG, latency, quality grade |
| **Overall Contribution** (multi-hop) | How this hop contributed to the final answer |
| **Ground Truth** | GT recall/precision if gold docs were provided |
| **Context Passages** | All retrieved documents with relevance labels |
| **Seer Evaluation Output** | The raw XML output from Seer's evaluator |
| **Trace Info** | Trace ID and span ID for correlation |
### Passage Visualization
Each passage in the context shows:
* **Position** and **ID** (e.g., `#1 • ID: doc-123`)
* **Gold badge** if this doc is in ground truth
* **Relevant badge** if Seer marked it as supporting requirements
* **Score** from your retriever
* **Full text** of the passage
* **Source** if provided
Color coding:
* **Green border**: Relevant passage (correctly retrieved)
* **Yellow border**: Gold doc not marked relevant (missed)
* **Gray border**: Not relevant, not gold
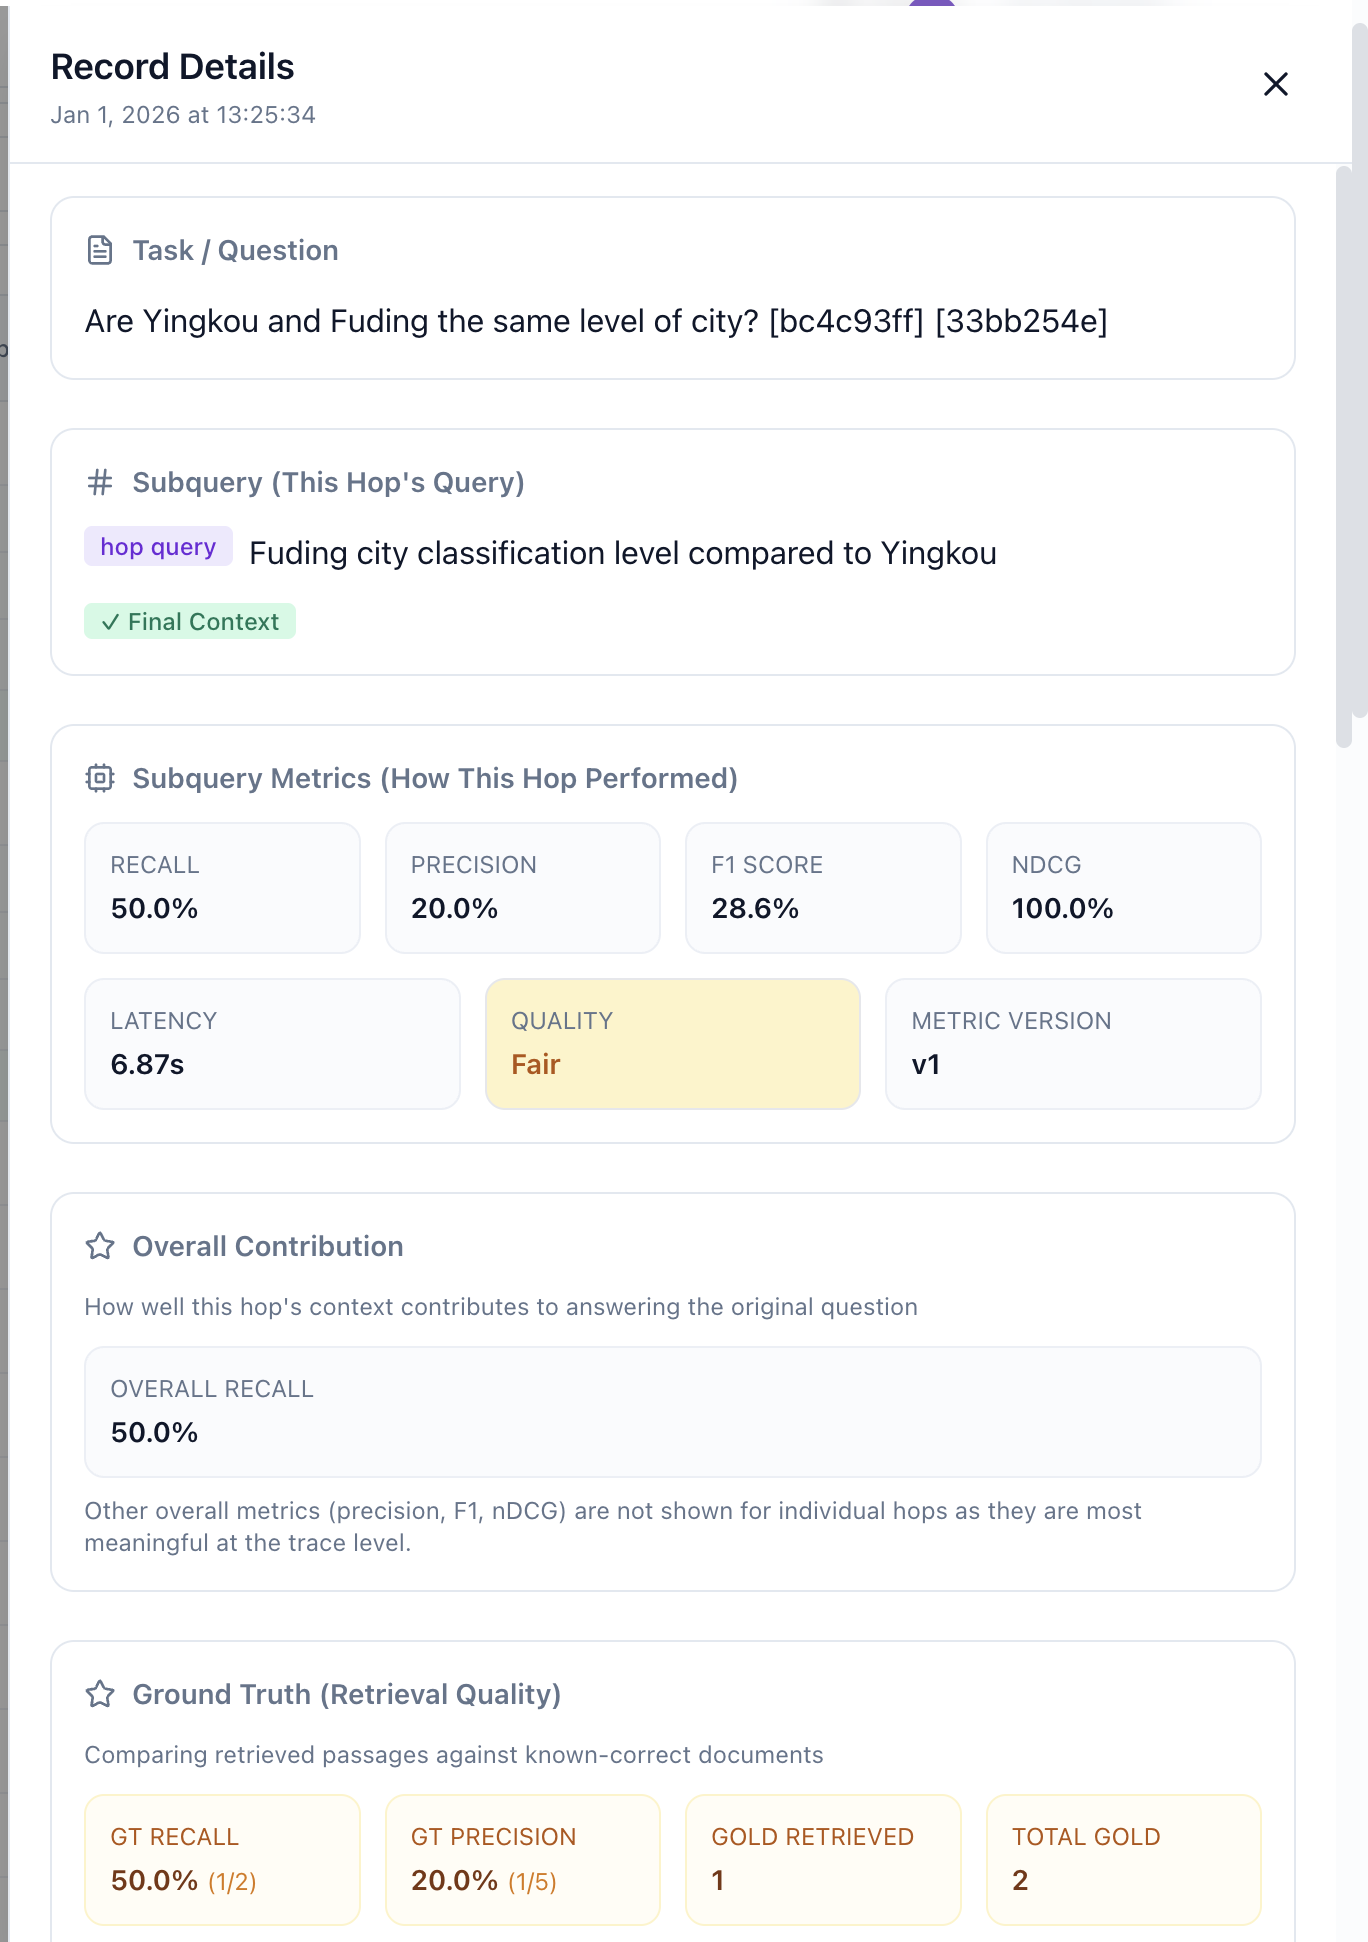 *Record Detail Drawer showing a multi-hop span with subquery, metrics, overall contribution, and ground truth validation.*
***
## Ground Truth Validation
When you log records with [`gold_doc_ids`](/context-and-event-schema#ground-truth-testing-seers-accuracy), the detail views show:
| Metric | Formula | What It Tells You |
| --------------------- | ---------------------------- | ---------------------------------------- |
| **GT Recall** | Gold found / Total gold | % of known-good docs you retrieved |
| **GT Precision** | Gold found / Total retrieved | % of retrieved docs that are gold |
| **Missing Gold Docs** | List of IDs | Exactly which docs your retriever missed |
This is crucial for understanding retrieval quality independent of Seer's evaluation.
***
## Multi-Hop Retrieval Support
For traces with multiple spans, the Logs page shows the complete journey:
### In Traces View:
* **Hop count badge** on each trace (e.g., "3 hops")
* **Subquery column** showing per-hop recall
* **Depth indicator** for complex trace structures
### In Detail Views:
* **Recall progression chart** visualizing improvement across hops
* **Delta indicators** showing how each hop changed overall recall
* **Effectiveness badges** for hops that improved recall
* **Final context marker** showing which hop's output was used
### Example Journey
```
Query: "What is the capital of France and its population?"
├─ retrieval_hop_1: "capital of France" → 72% recall (+72%)
├─ retrieval_hop_2: "population of Paris" → 85% recall (+13%)
└─ context_join: Combined context → 92% recall (+7%) FINAL
```
***
## Working with Logs
### Debugging a Low-Quality Query
1. Filter by **Quality: Poor**
2. Click a record to open the detail drawer
3. Check **Context Passages**:
* Are relevant docs missing entirely?
* Are docs present but scored low?
* Are irrelevant docs ranked high?
4. Check **Ground Truth** (if available):
* Which gold docs are missing?
5. Check **Seer Evaluation Output**:
* Which requirements were not covered?
### Investigating a Failed Trace
1. Switch to **Traces** view
2. Filter by **Status: Failed**
3. Expand the trace to see which span failed
4. Open the **Record Detail** for the failed span
5. Check the **Error Details** section
### Comparing Multi-Hop Performance
1. In **Traces** view, toggle to **Avg** metric mode
2. Sort by **Overall** ascending to find traces where avg is much lower than final
3. These traces have inefficient early hops that later hops had to compensate for
***
## Pagination
Both views support pagination:
* **Page size**: 10, 25, 50, 100 records per page
* **Navigation**: Previous/Next with page number display
* **URL persistence**: Filters and page state are saved in the URL for sharing
***
## Coming Soon
* **Export**: Download filtered logs as CSV/JSON
* **Saved filters**: Save common filter combinations
* **Direct linking**: Deep links from monitoring dashboard to filtered logs
* **Annotations**: Add tags and notes to specific records
***
## See Also
* [Metrics](/metrics)
* [Multi-Hop Retrieval](/multi-hop-retrieval)
* [Production Monitoring](/production-monitoring)
* [Context and Event Schema](/context-and-event-schema)
*Record Detail Drawer showing a multi-hop span with subquery, metrics, overall contribution, and ground truth validation.*
***
## Ground Truth Validation
When you log records with [`gold_doc_ids`](/context-and-event-schema#ground-truth-testing-seers-accuracy), the detail views show:
| Metric | Formula | What It Tells You |
| --------------------- | ---------------------------- | ---------------------------------------- |
| **GT Recall** | Gold found / Total gold | % of known-good docs you retrieved |
| **GT Precision** | Gold found / Total retrieved | % of retrieved docs that are gold |
| **Missing Gold Docs** | List of IDs | Exactly which docs your retriever missed |
This is crucial for understanding retrieval quality independent of Seer's evaluation.
***
## Multi-Hop Retrieval Support
For traces with multiple spans, the Logs page shows the complete journey:
### In Traces View:
* **Hop count badge** on each trace (e.g., "3 hops")
* **Subquery column** showing per-hop recall
* **Depth indicator** for complex trace structures
### In Detail Views:
* **Recall progression chart** visualizing improvement across hops
* **Delta indicators** showing how each hop changed overall recall
* **Effectiveness badges** for hops that improved recall
* **Final context marker** showing which hop's output was used
### Example Journey
```
Query: "What is the capital of France and its population?"
├─ retrieval_hop_1: "capital of France" → 72% recall (+72%)
├─ retrieval_hop_2: "population of Paris" → 85% recall (+13%)
└─ context_join: Combined context → 92% recall (+7%) FINAL
```
***
## Working with Logs
### Debugging a Low-Quality Query
1. Filter by **Quality: Poor**
2. Click a record to open the detail drawer
3. Check **Context Passages**:
* Are relevant docs missing entirely?
* Are docs present but scored low?
* Are irrelevant docs ranked high?
4. Check **Ground Truth** (if available):
* Which gold docs are missing?
5. Check **Seer Evaluation Output**:
* Which requirements were not covered?
### Investigating a Failed Trace
1. Switch to **Traces** view
2. Filter by **Status: Failed**
3. Expand the trace to see which span failed
4. Open the **Record Detail** for the failed span
5. Check the **Error Details** section
### Comparing Multi-Hop Performance
1. In **Traces** view, toggle to **Avg** metric mode
2. Sort by **Overall** ascending to find traces where avg is much lower than final
3. These traces have inefficient early hops that later hops had to compensate for
***
## Pagination
Both views support pagination:
* **Page size**: 10, 25, 50, 100 records per page
* **Navigation**: Previous/Next with page number display
* **URL persistence**: Filters and page state are saved in the URL for sharing
***
## Coming Soon
* **Export**: Download filtered logs as CSV/JSON
* **Saved filters**: Save common filter combinations
* **Direct linking**: Deep links from monitoring dashboard to filtered logs
* **Annotations**: Add tags and notes to specific records
***
## See Also
* [Metrics](/metrics)
* [Multi-Hop Retrieval](/multi-hop-retrieval)
* [Production Monitoring](/production-monitoring)
* [Context and Event Schema](/context-and-event-schema)