> ## Documentation Index
> Fetch the complete documentation index at: https://docs.seersearch.com/llms.txt
> Use this file to discover all available pages before exploring further.
# Monitoring Dashboard
> Track retrieval quality trends over time
Make your retrieval performance measurable. Set SLOs, track trends over time, and catch regressions before they impact users, all with low-overhead sampling.
> **Prerequisites:** You've completed the [Quickstart](/quickstart) and understand the [Context & Event Schema](/context-and-event-schema).
***
## What You Get
* **Evaluator-defined Recall** on **unlabeled** traffic (flag queries with `recall < 1.0`)
* **Precision (proxy)**: Ratio of supporting passages to total context (detects context bloat)
* **F1 & nDCG** derived from recall + precision
* **P95 Latency** tracking for evaluation time
* **Trend charts** to catch drift over time
* **Environment filtering** to compare prod vs staging vs dev
* **Evaluator Accuracy** (when ground truth is provided)
***
## Enable Monitoring
Control volume with `sample_rate` to manage costs.
```python theme={null}
from seer import SeerClient
import os
client = SeerClient()
def retrieve(query: str) -> list[dict]:
# your real retriever here
return [{"text": "...", "score": 0.9}]
def handle_request(query: str):
context = retrieve(query)
client.log(
task=query,
context=context,
metadata={
"env": os.getenv("APP_ENV", "prod"),
"feature_flag": "retrieval-v1",
},
sample_rate=0.10, # 10% of calls are evaluated
)
```
```typescript theme={null}
import { SeerClient } from '@seer/sdk';
const client = new SeerClient();
function retrieve(query: string) {
// your real retriever here
return [{ text: "...", score: 0.9 }];
}
function handleRequest(query: string) {
const context = retrieve(query);
client.log({
task: query,
context: context,
metadata: {
env: process.env.APP_ENV ?? "prod",
feature_flag: "retrieval-v1",
},
sample_rate: 0.10, // 10% of calls are evaluated
});
}
```
### Sampling Guidance
| Use Case | Recommended `sample_rate` |
| -------------------------- | ----------------------------- |
| **Change testing** | `1.0` (100%) for test queries |
| **High-volume production** | `0.05` - `0.10` (5-10%) |
| **Low-volume or critical** | `0.25` - `0.50` (25-50%) |
| **Debugging** | `1.0` temporarily |
***
## Smart Sampling with Decorator
Use the decorator with dynamic sampling based on metadata:
```python theme={null}
from seer import seer_trace
import os
@seer_trace(
task_arg="query",
context_from_return=True,
metadata={"env": os.getenv("APP_ENV", "prod")},
sample_rate=0.10, # 10% sampling
)
def retrieve(query: str) -> list[dict]:
return [{"text": "...", "score": 0.9}]
# Logs automatically when called
results = retrieve("user question...")
```
***
## The Monitoring Dashboard
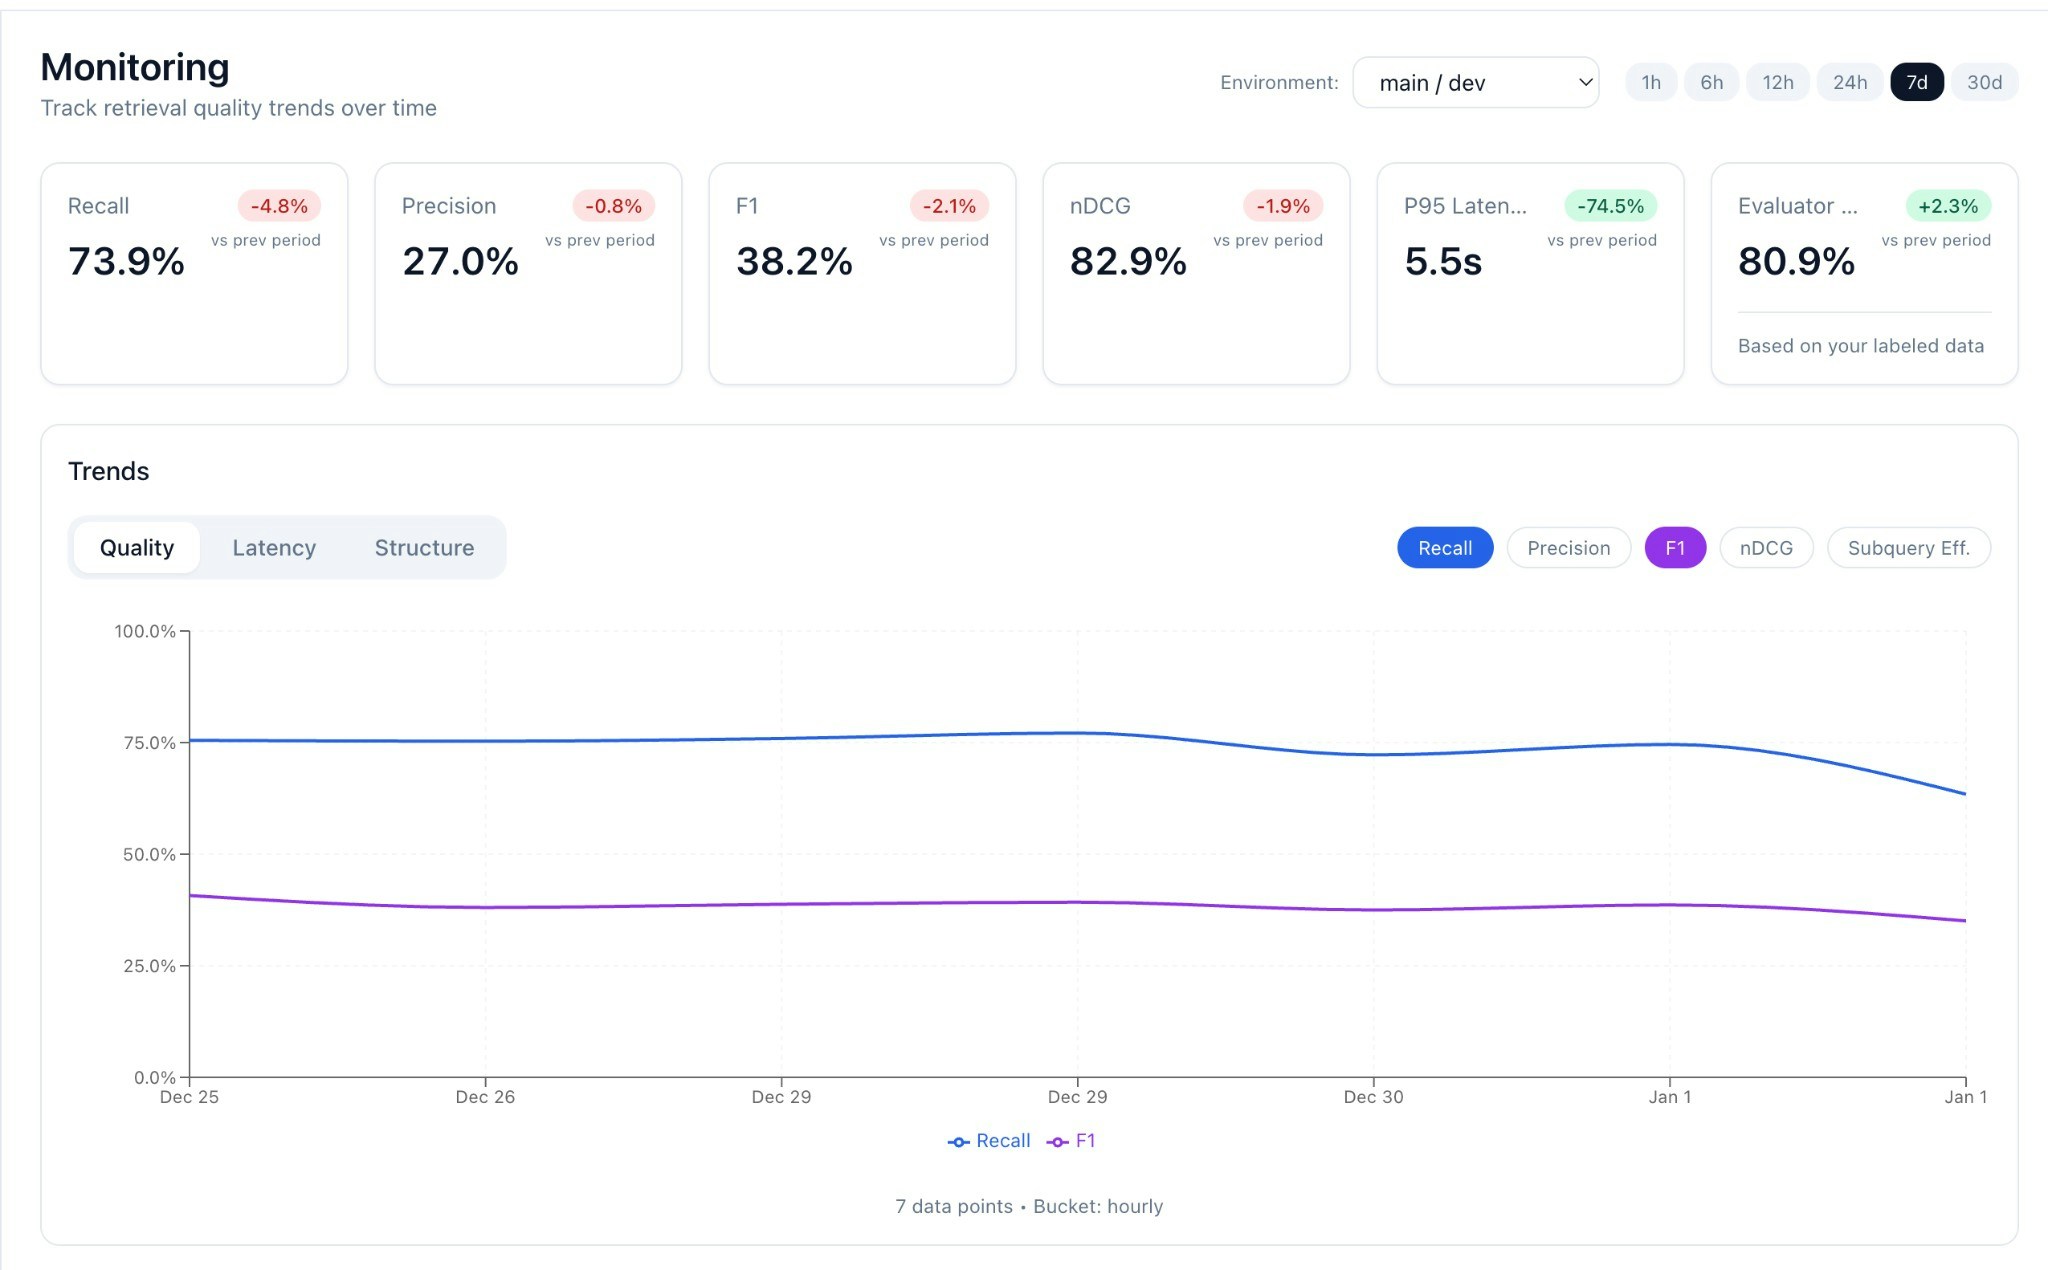 ### KPI Cards
At the top, you'll see summary metrics for the selected period:
| Metric | Description |
| ---------------------- | ---------------------------------------------------------- |
| **Recall** | Average fraction of requirements covered |
| **Precision** | Average fraction of supporting documents |
| **F1** | Harmonic mean of recall and precision |
| **nDCG** | Ranking quality (if scores provided) |
| **P95 Latency** | 95th percentile evaluation time |
| **Evaluator Accuracy** | F1 against your ground truth (shown when gold data exists) |
Each card shows **delta vs. previous period** (e.g., +2.1% week-over-week).
### Trend Charts
The trend chart has three tabs:
| Tab | Metrics | Scale |
| ------------- | --------------------------------------------------- | ------------ |
| **Quality** | Recall, Precision, F1, nDCG, Subquery Effectiveness | 0-100% |
| **Latency** | P50, P95 evaluation latency | milliseconds |
| **Structure** | Trace Depth (multi-hop only) | count |
Toggle individual metrics on/off to focus your analysis.
#### Latency Tab
### KPI Cards
At the top, you'll see summary metrics for the selected period:
| Metric | Description |
| ---------------------- | ---------------------------------------------------------- |
| **Recall** | Average fraction of requirements covered |
| **Precision** | Average fraction of supporting documents |
| **F1** | Harmonic mean of recall and precision |
| **nDCG** | Ranking quality (if scores provided) |
| **P95 Latency** | 95th percentile evaluation time |
| **Evaluator Accuracy** | F1 against your ground truth (shown when gold data exists) |
Each card shows **delta vs. previous period** (e.g., +2.1% week-over-week).
### Trend Charts
The trend chart has three tabs:
| Tab | Metrics | Scale |
| ------------- | --------------------------------------------------- | ------------ |
| **Quality** | Recall, Precision, F1, nDCG, Subquery Effectiveness | 0-100% |
| **Latency** | P50, P95 evaluation latency | milliseconds |
| **Structure** | Trace Depth (multi-hop only) | count |
Toggle individual metrics on/off to focus your analysis.
#### Latency Tab
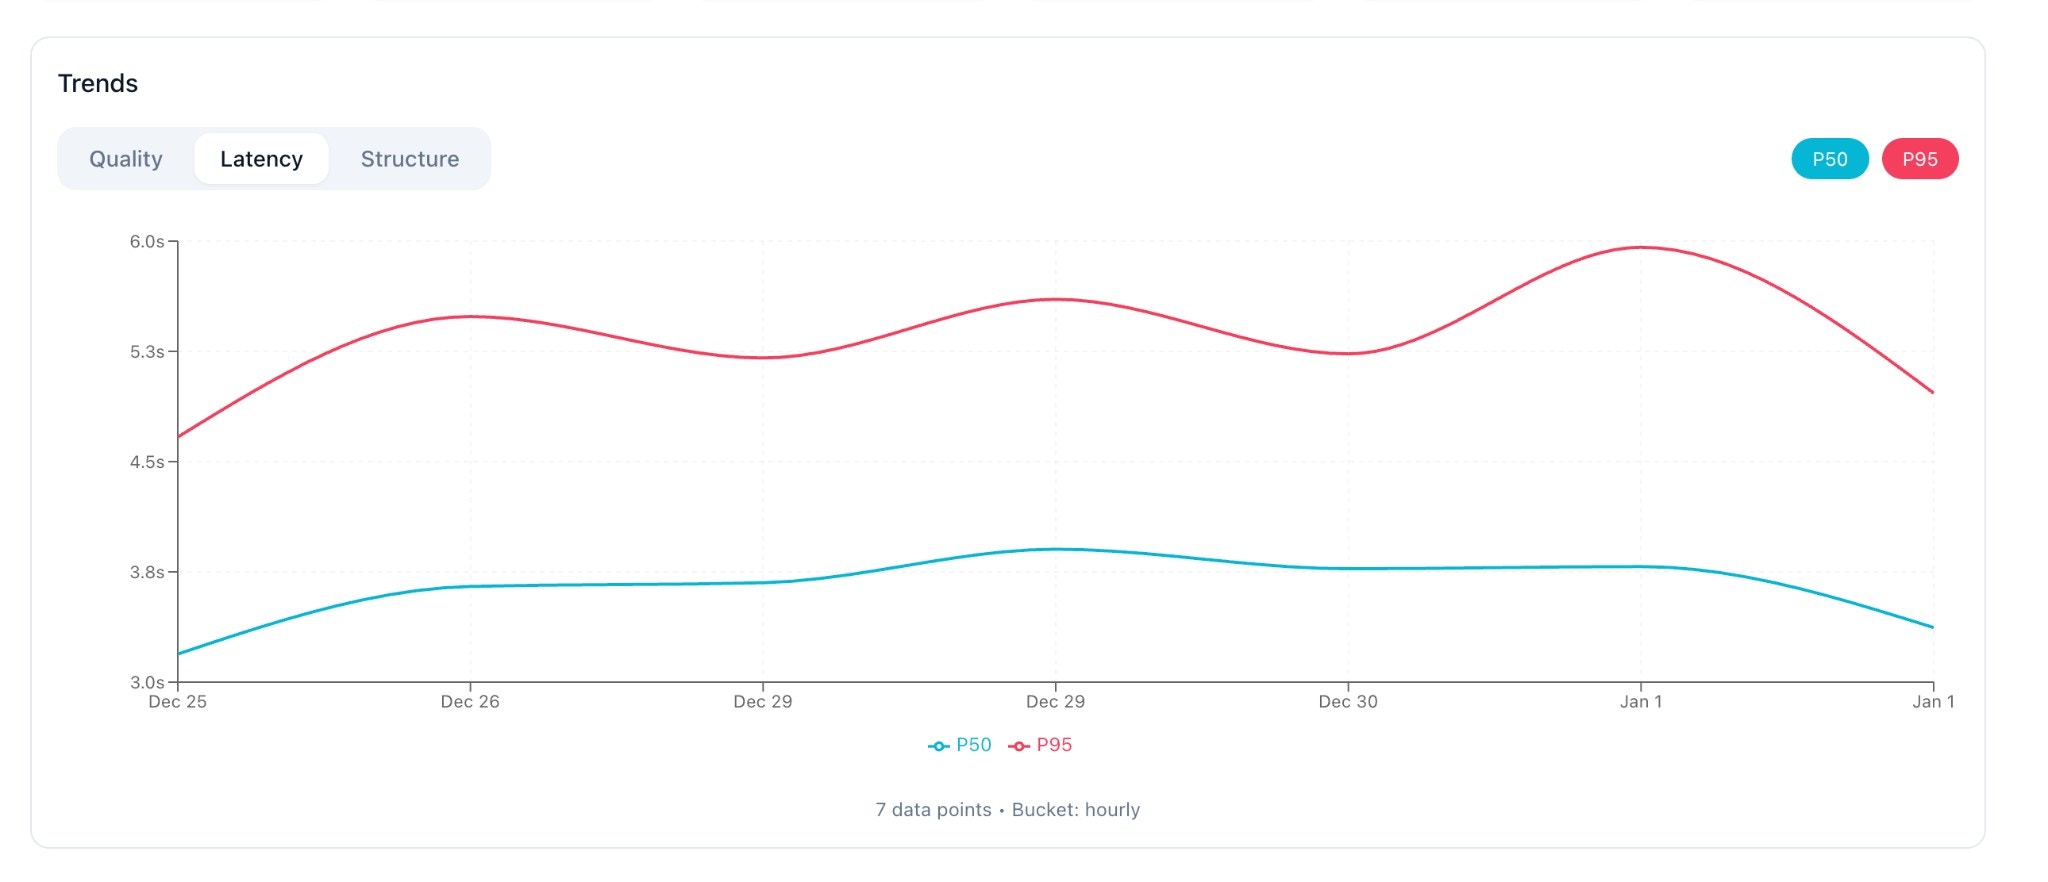 Track evaluation latency percentiles over time. Useful for detecting slow-downs or backend issues.
#### Structure Tab
Track evaluation latency percentiles over time. Useful for detecting slow-downs or backend issues.
#### Structure Tab
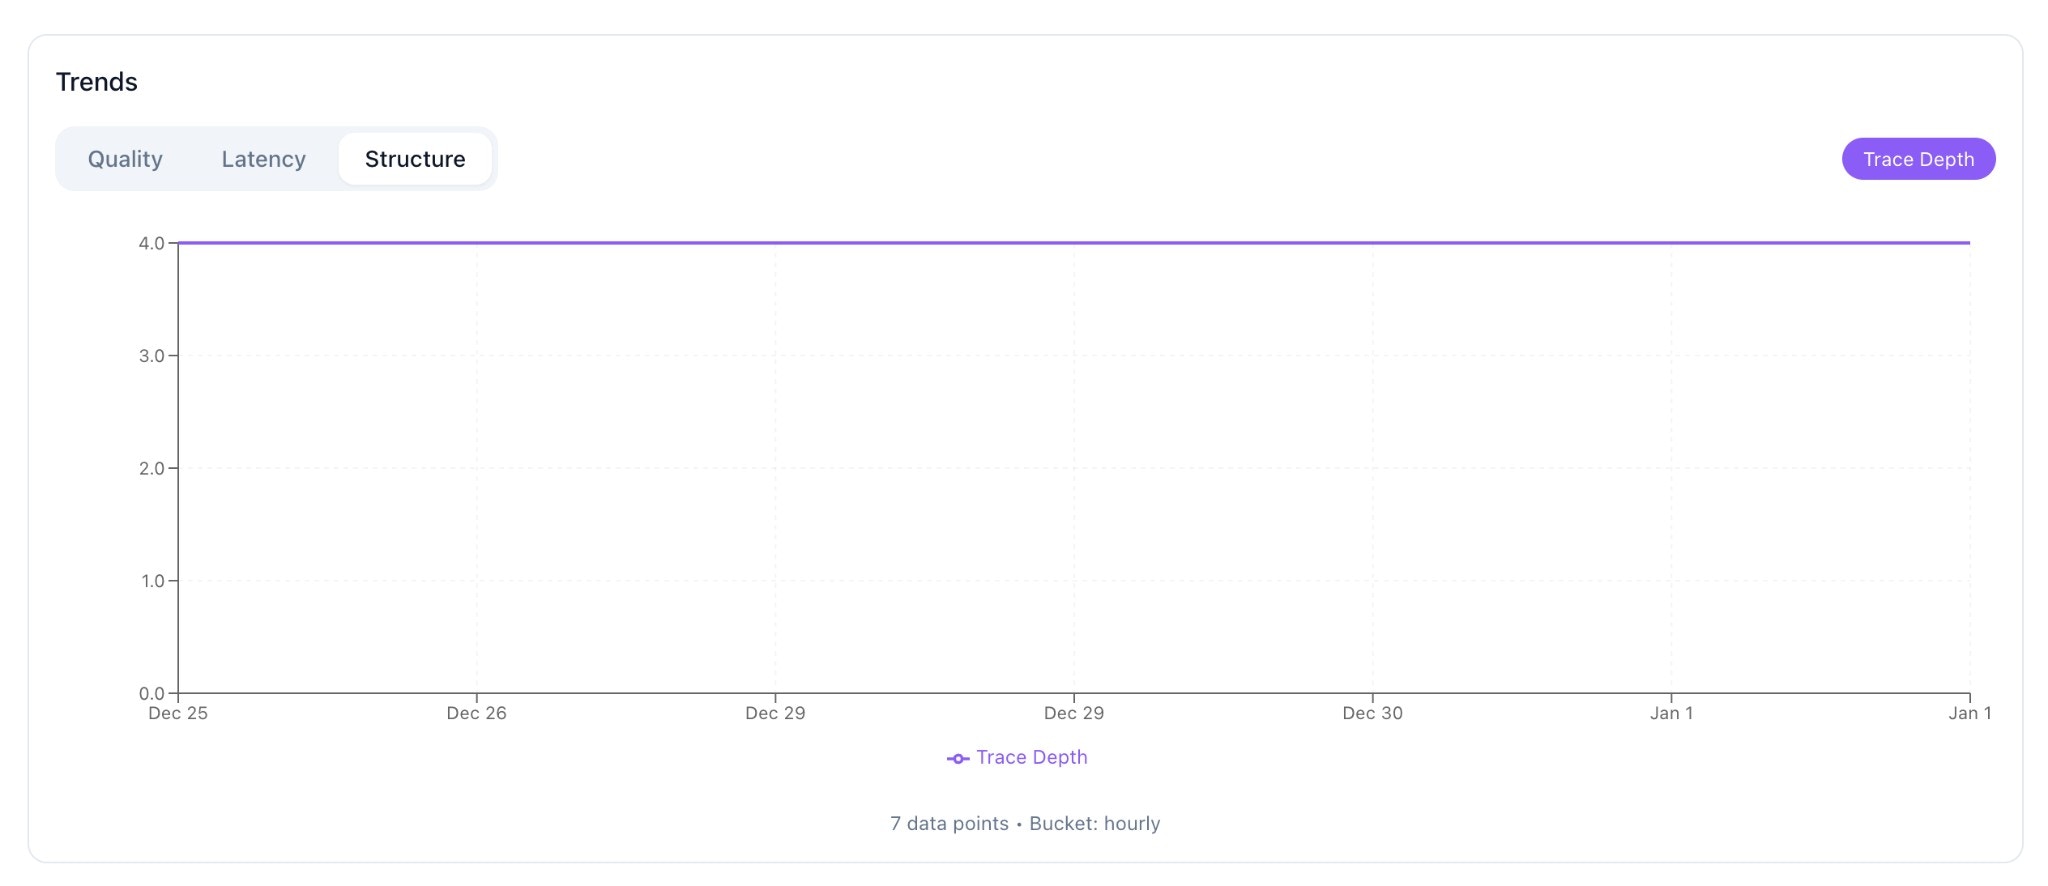 For multi-hop retrieval, track trace depth to understand query complexity trends.
### Filtering
Filter your view using:
* **Environment**: Select a specific env (prod, staging, dev)
* **Period**: 24 hours, 7 days, or 30 days
We're adding support for filtering by `feature_flag` and custom metadata fields directly in the Monitoring dashboard. For now, use the [A/B Testing](/change-testing) page to compare feature flags.
***
## Cost Management
* **Sampling** keeps evaluation cost predictable. Start at `0.05` and tune up if needed.
* **SDK batching** minimizes request overhead (events are queued and sent in batches).
* **Async mode** (default) — logging never blocks your request path.
### Estimated Costs
| Monthly Evaluations | Seer Cost |
| ------------------- | --------------- |
| 100k | \~\$16-20 |
| 1M | \~\$160-200 |
| 10M | \~\$1,600-2,000 |
***
## Privacy Considerations
* **You control what you send.** If passages are sensitive, include only what's needed for evaluation.
* Use `metadata` to tag records with access boundaries (e.g., `collection`, `tenant_id`) for future filtering.
* Consider truncating or summarizing very long passages.
***
## Example: Tier-Based Sampling
```python theme={null}
from seer import SeerClient
client = SeerClient()
def handle_request(query: str, user_tier: str):
context = retrieve(query)
# Higher sampling for enterprise customers
rate = 0.25 if user_tier == "enterprise" else 0.05
client.log(
task=query,
context=context,
metadata={
"env": "prod",
"user_tier": user_tier,
"feature_flag": "retrieval-v1",
},
sample_rate=rate,
)
```
***
## See Also
* [Quickstart](/quickstart)
* [Context & Event Schema](/context-and-event-schema)
* [Metrics](/metrics)
* [Change Testing (A/B)](/change-testing)
* [Alerting](/alerts)
For multi-hop retrieval, track trace depth to understand query complexity trends.
### Filtering
Filter your view using:
* **Environment**: Select a specific env (prod, staging, dev)
* **Period**: 24 hours, 7 days, or 30 days
We're adding support for filtering by `feature_flag` and custom metadata fields directly in the Monitoring dashboard. For now, use the [A/B Testing](/change-testing) page to compare feature flags.
***
## Cost Management
* **Sampling** keeps evaluation cost predictable. Start at `0.05` and tune up if needed.
* **SDK batching** minimizes request overhead (events are queued and sent in batches).
* **Async mode** (default) — logging never blocks your request path.
### Estimated Costs
| Monthly Evaluations | Seer Cost |
| ------------------- | --------------- |
| 100k | \~\$16-20 |
| 1M | \~\$160-200 |
| 10M | \~\$1,600-2,000 |
***
## Privacy Considerations
* **You control what you send.** If passages are sensitive, include only what's needed for evaluation.
* Use `metadata` to tag records with access boundaries (e.g., `collection`, `tenant_id`) for future filtering.
* Consider truncating or summarizing very long passages.
***
## Example: Tier-Based Sampling
```python theme={null}
from seer import SeerClient
client = SeerClient()
def handle_request(query: str, user_tier: str):
context = retrieve(query)
# Higher sampling for enterprise customers
rate = 0.25 if user_tier == "enterprise" else 0.05
client.log(
task=query,
context=context,
metadata={
"env": "prod",
"user_tier": user_tier,
"feature_flag": "retrieval-v1",
},
sample_rate=rate,
)
```
***
## See Also
* [Quickstart](/quickstart)
* [Context & Event Schema](/context-and-event-schema)
* [Metrics](/metrics)
* [Change Testing (A/B)](/change-testing)
* [Alerting](/alerts)