

Alerting
Get notified when your retrieval quality degrades. Seer’s alerting system monitors your metrics and sends webhook notifications when thresholds are breached.Prerequisites: You have data flowing through Seer (see Quickstart) and understand Metrics.
Default Alerts
When you onboard, Seer automatically creates three default alerts:
These alerts fire when the metric drops by the specified percentage compared to the previous period.
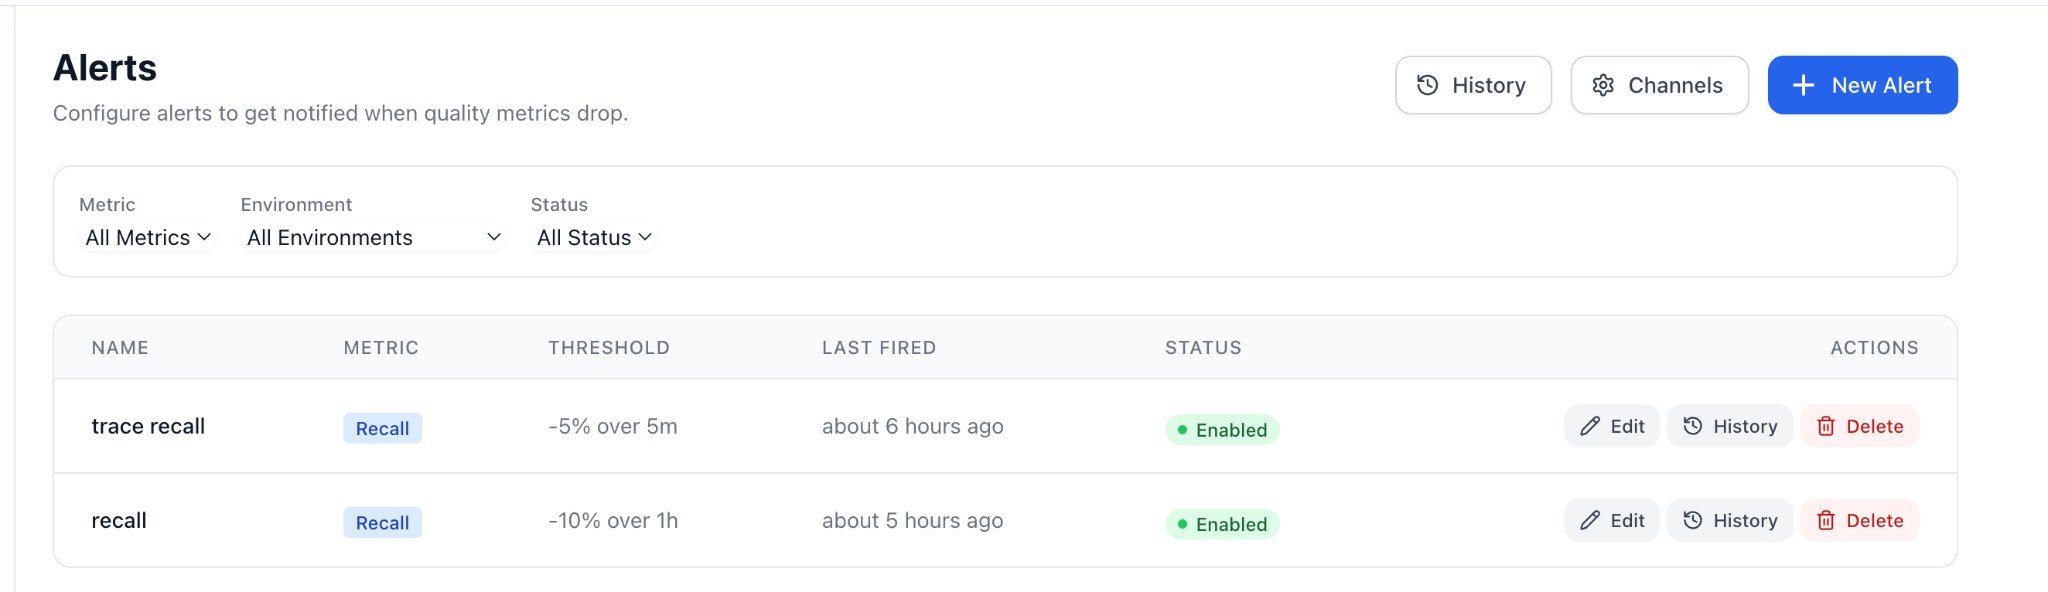
Alert Configuration
Metric Types
Threshold Types
Time Windows
Choose how much data to compare:Evaluation Scope
For most use cases, Trace is recommended as it reflects the end-user experience.
Cooldown
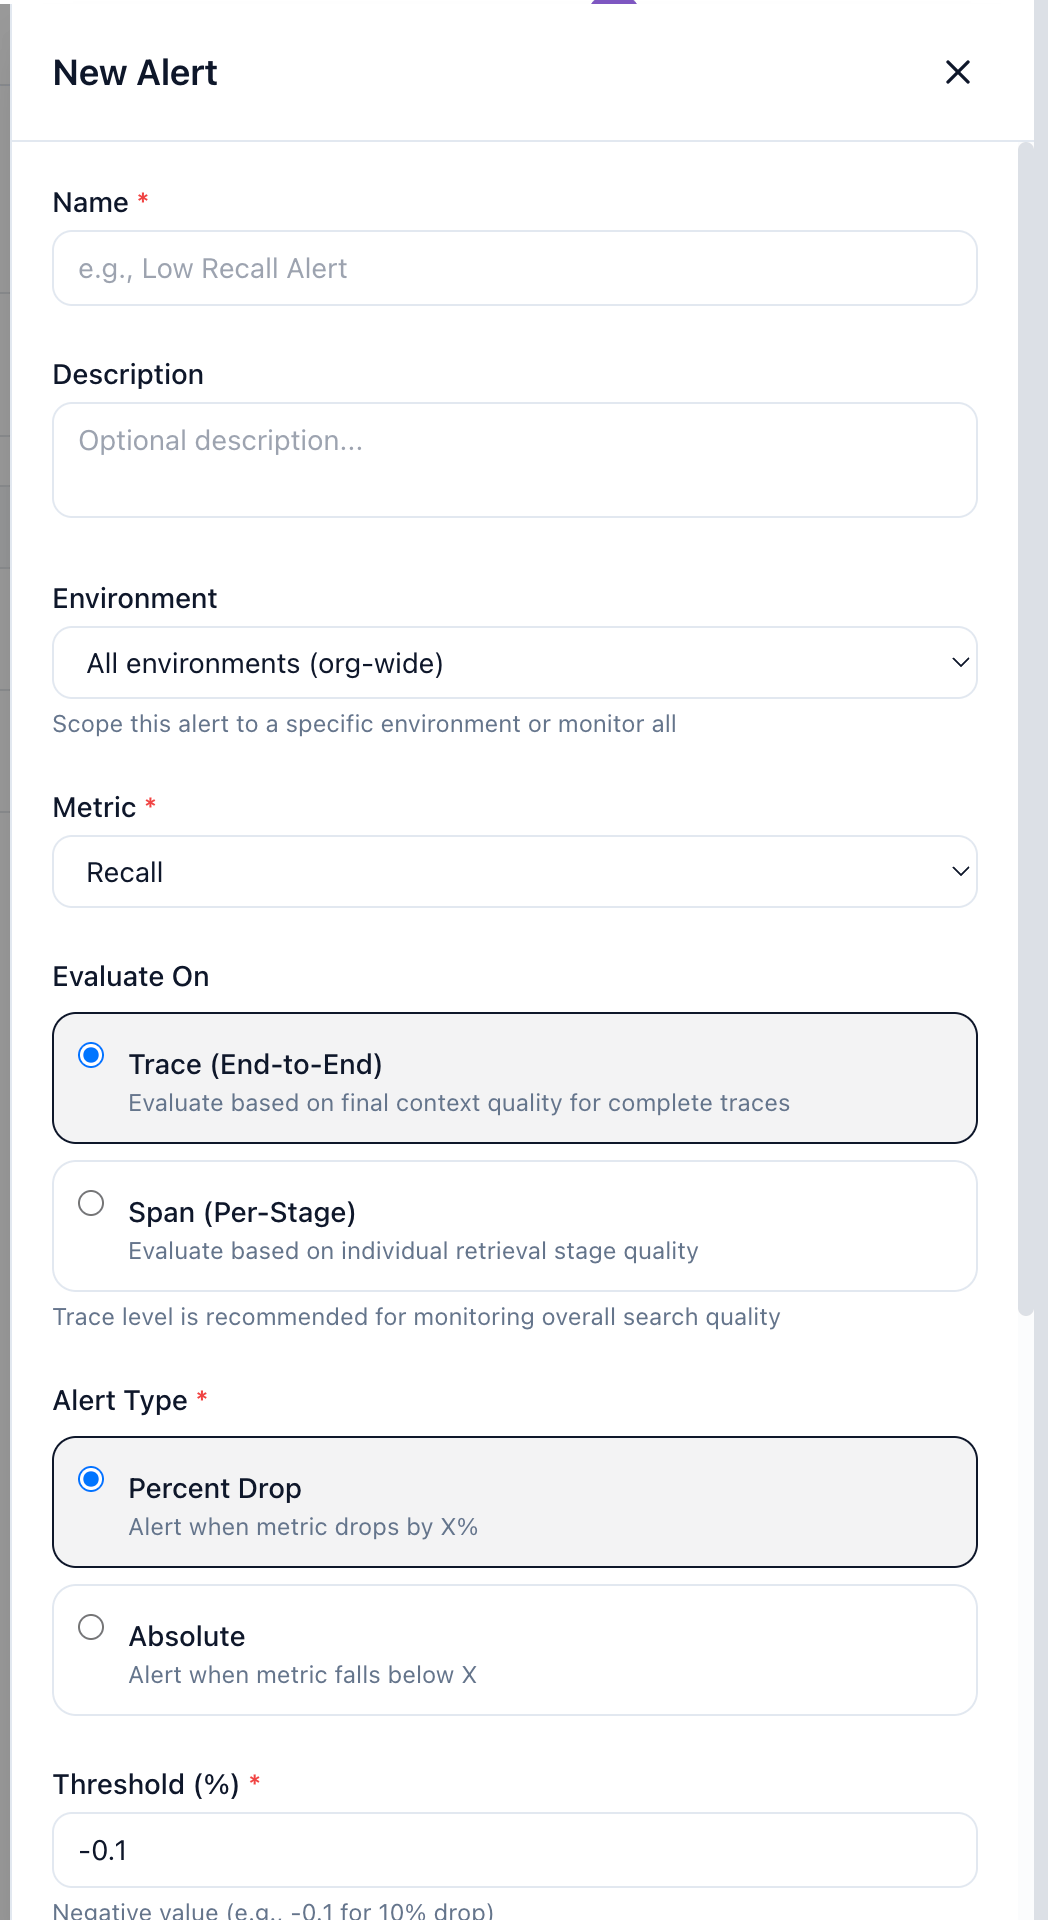
Minimum time between repeat alerts (1 minute to 7 days). Prevents alert fatigue during extended incidents.Creating an Alert
- Navigate to Alerts in the sidebar
- Click New Alert
- Configure:
- Name: Descriptive name (e.g., “Production Recall SLO”)
- Metric: Which metric to monitor
- Scope: Trace or Span level
- Threshold Type: Percent drop or absolute
- Threshold Value: The trigger point
- Time Window: Comparison period
- Environment: Specific env or org-wide
- Cooldown: Time between alerts
- Channels: Where to send notifications
- Click Create Alert
Notification Channels
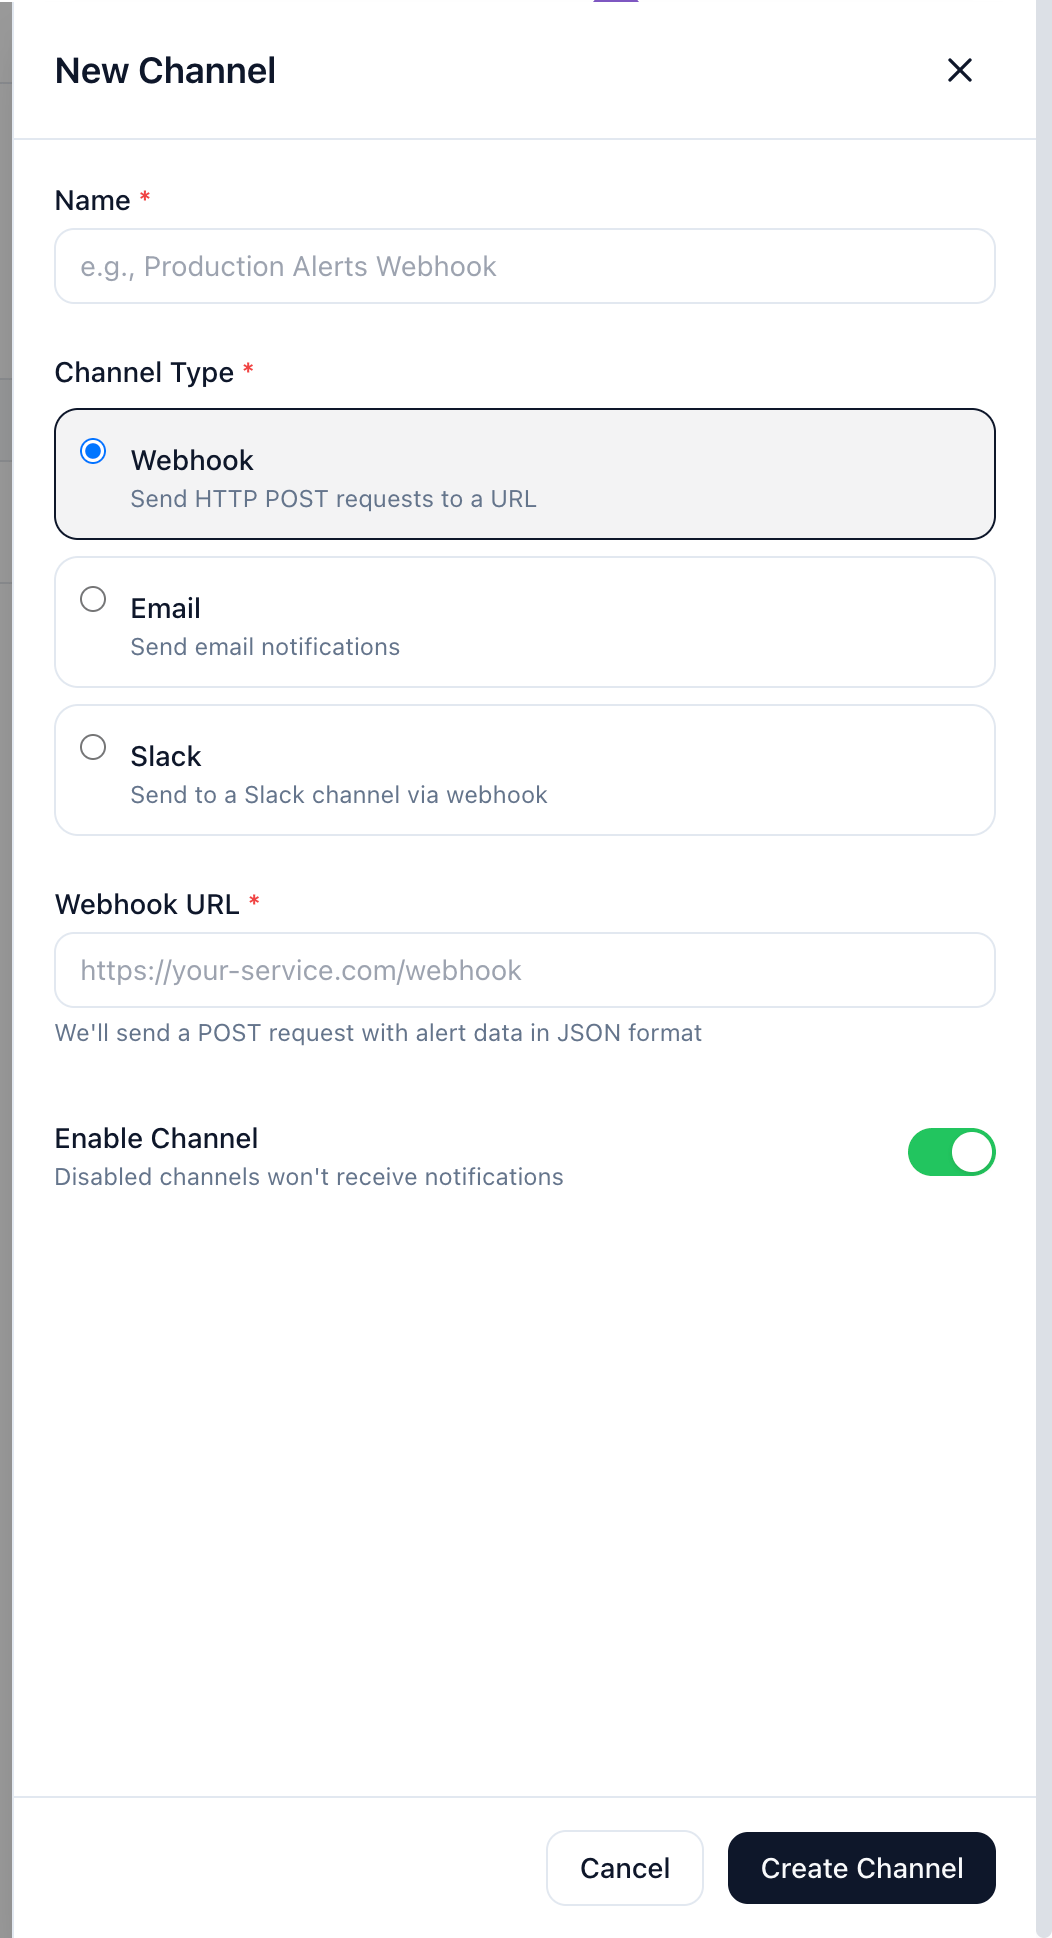
Alerts are sent to webhook endpoints you configure.Setting Up a Webhook Channel
- Go to Alerts → Channels
- Click New Channel
- Enter:
- Name: Descriptive name (e.g., “Slack #alerts”)
- Channel Type: Webhook, Email, or Slack
- URL: Your webhook endpoint
- Enable the channel
- Click Create Channel

Webhook Payload
When an alert fires, Seer sends a POST request with this payload:Slack Integration
Use Slack’s Incoming Webhooks to send alerts to a channel:- Create an Incoming Webhook in Slack
- Add the webhook URL as a Seer channel
- Link the channel to your alerts
PagerDuty Integration
Use PagerDuty’s Events API:- Create a PagerDuty service with Events API integration
- Use the integration URL as your Seer webhook
- Map the payload fields to PagerDuty’s format via a middleware (e.g., AWS Lambda, Zapier)
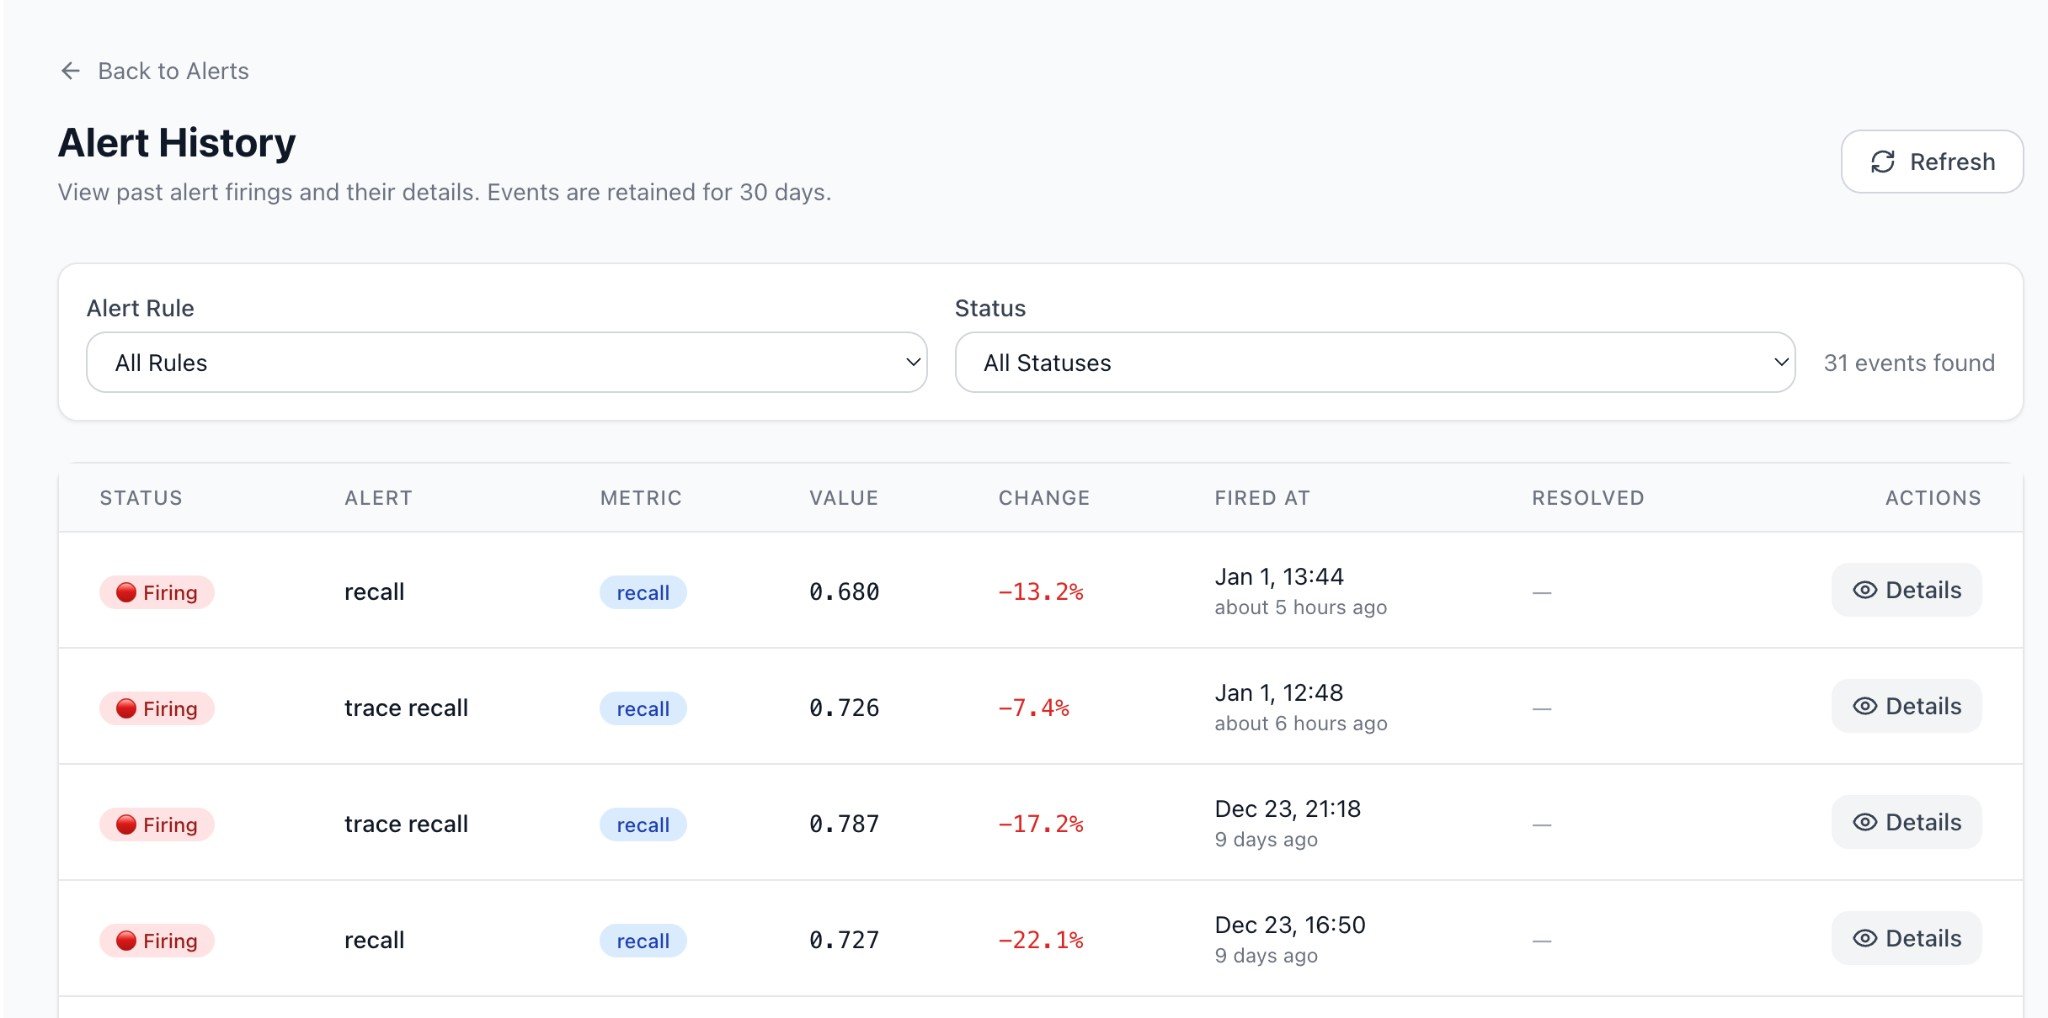
Alert History
View past alerts in Alerts → History:- Status: Firing or resolved
- Timestamp: When the alert fired
- Metric values: Current and previous values
- Change percent: How much the metric changed
Best Practices
1. Start with Defaults
The default alerts catch major regressions. Tune thresholds after observing your baseline.2. Use Environment Scoping
Create separate alerts for prod vs staging:3. Set Appropriate Cooldowns
- Critical alerts: 15-60 minutes (fast escalation)
- Warning alerts: 4-24 hours (reduce noise)
4. Test Your Webhooks
Use a service like webhook.site to test before connecting to Slack/PagerDuty.Coming Soon
- Metadata filtering (alert on specific
feature_flagvalues) - Resolved notifications (when metrics recover)
- Richer Slack formatting (interactive messages with action buttons)