Prerequisites: You’ve completed the Quickstart and understand the Context & Event Schema.
What You Get
- Evaluator-defined Recall on unlabeled traffic (flag queries with
recall < 1.0) - Precision (proxy): Ratio of supporting passages to total context (detects context bloat)
- F1 & nDCG derived from recall + precision
- P95 Latency tracking for evaluation time
- Trend charts to catch drift over time
- Environment filtering to compare prod vs staging vs dev
- Evaluator Accuracy (when ground truth is provided)
Enable Monitoring
Control volume withsample_rate to manage costs.
- Python
- TypeScript
Sampling Guidance
Smart Sampling with Decorator
Use the decorator with dynamic sampling based on metadata:The Monitoring Dashboard
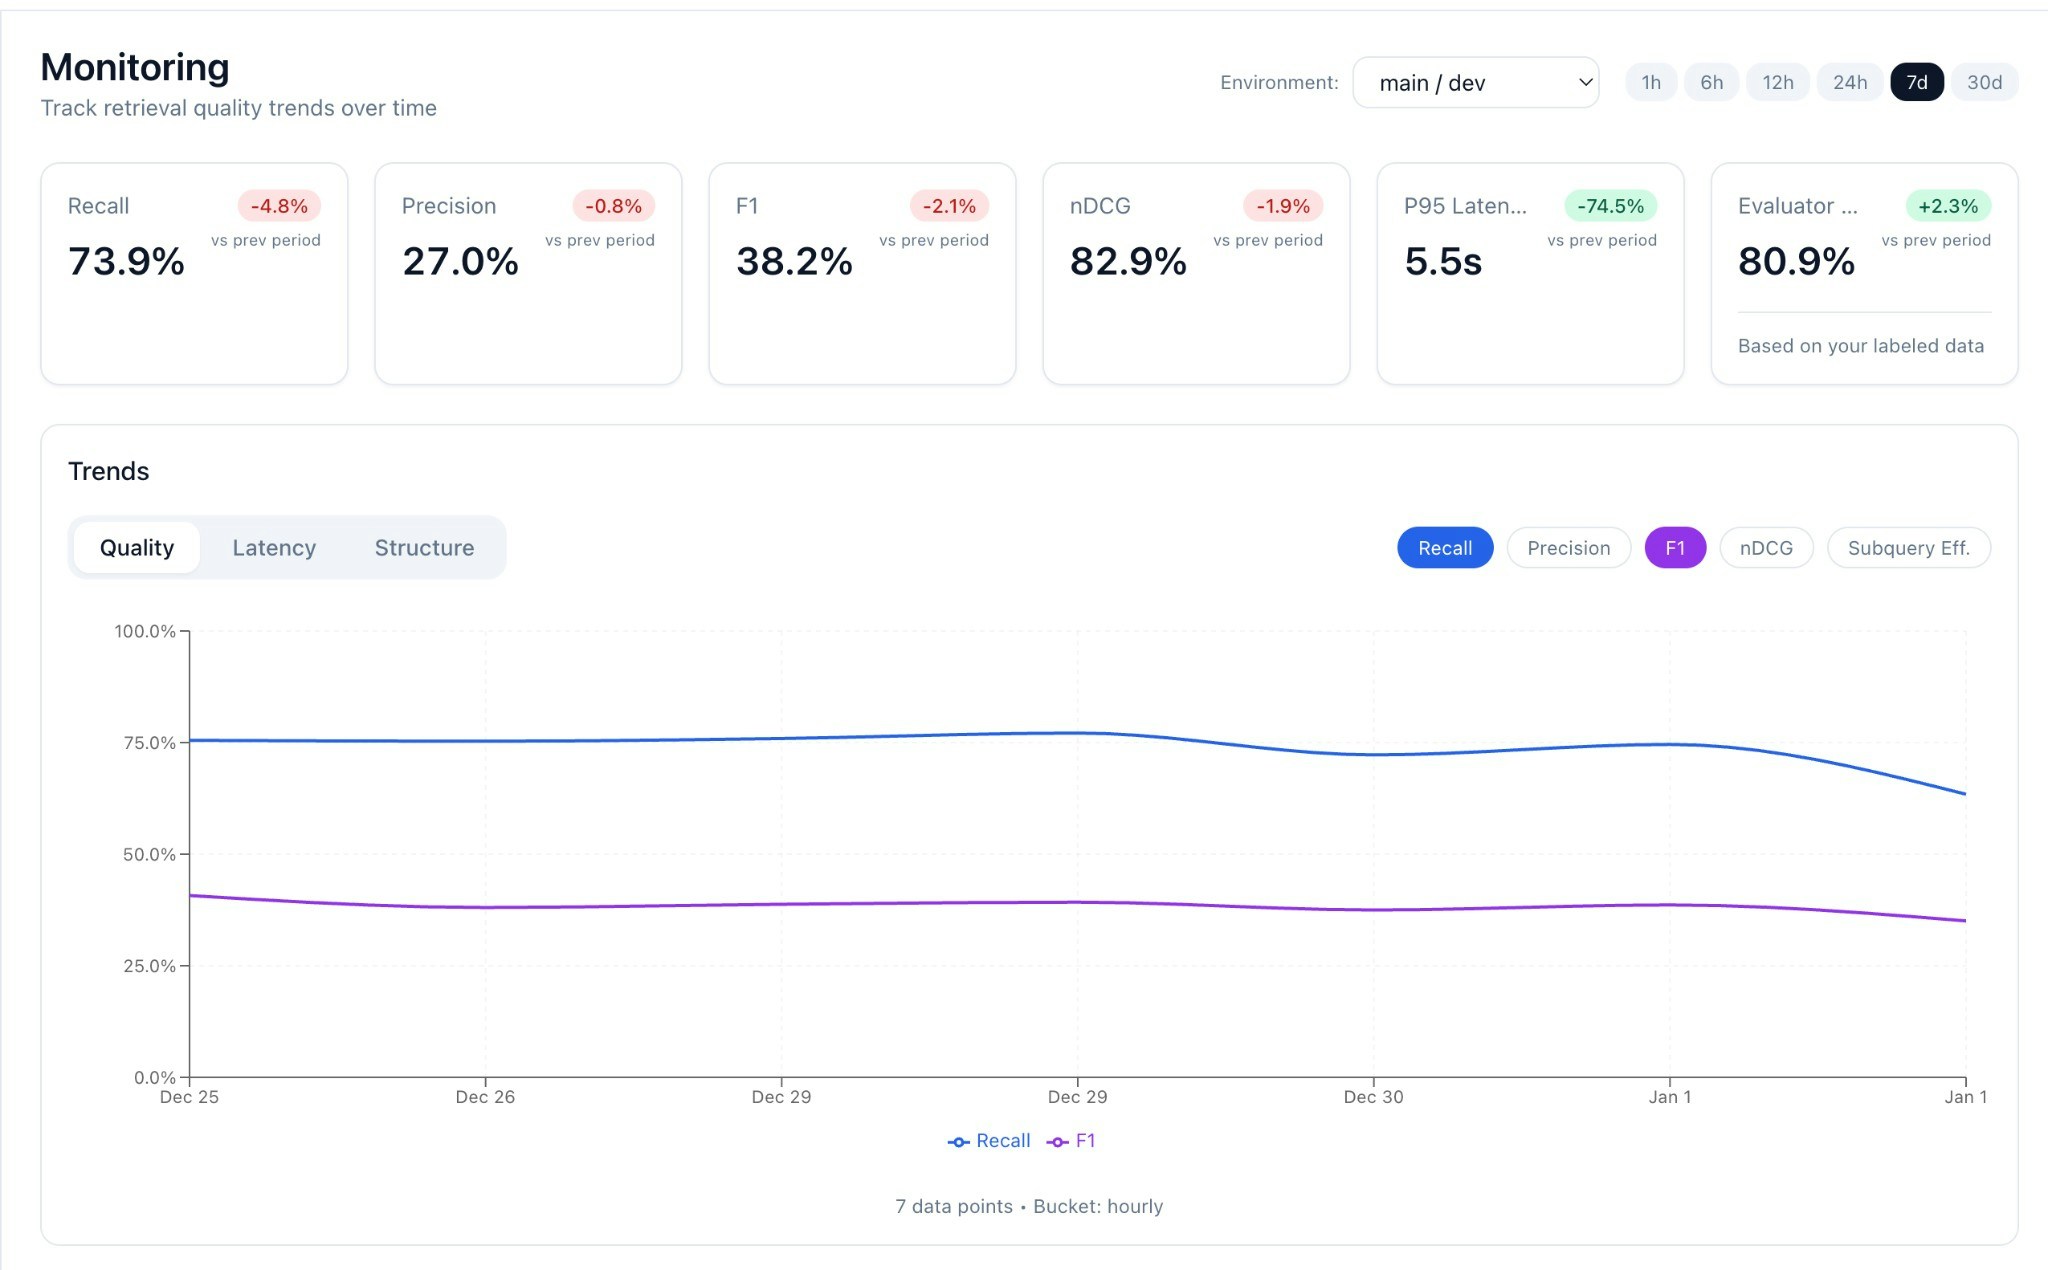
KPI Cards
At the top, you’ll see summary metrics for the selected period:
Each card shows delta vs. previous period (e.g., +2.1% week-over-week).
Trend Charts
The trend chart has three tabs:
Toggle individual metrics on/off to focus your analysis.
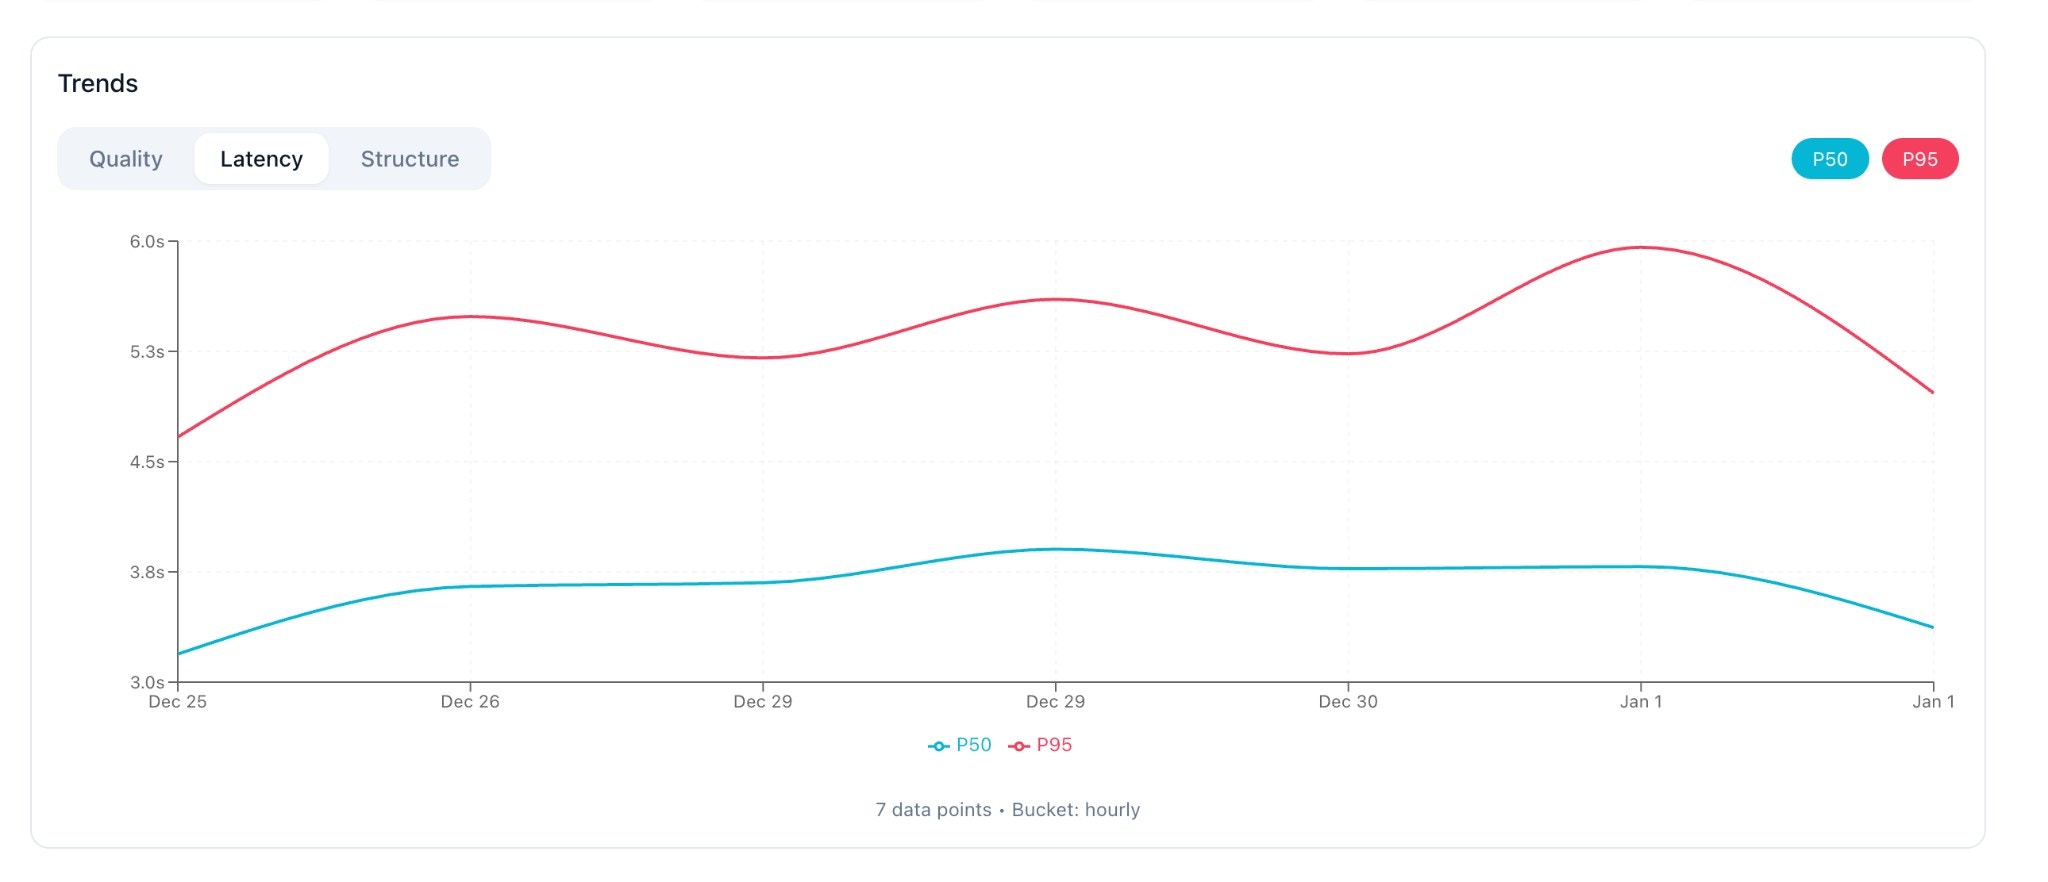
Latency Tab
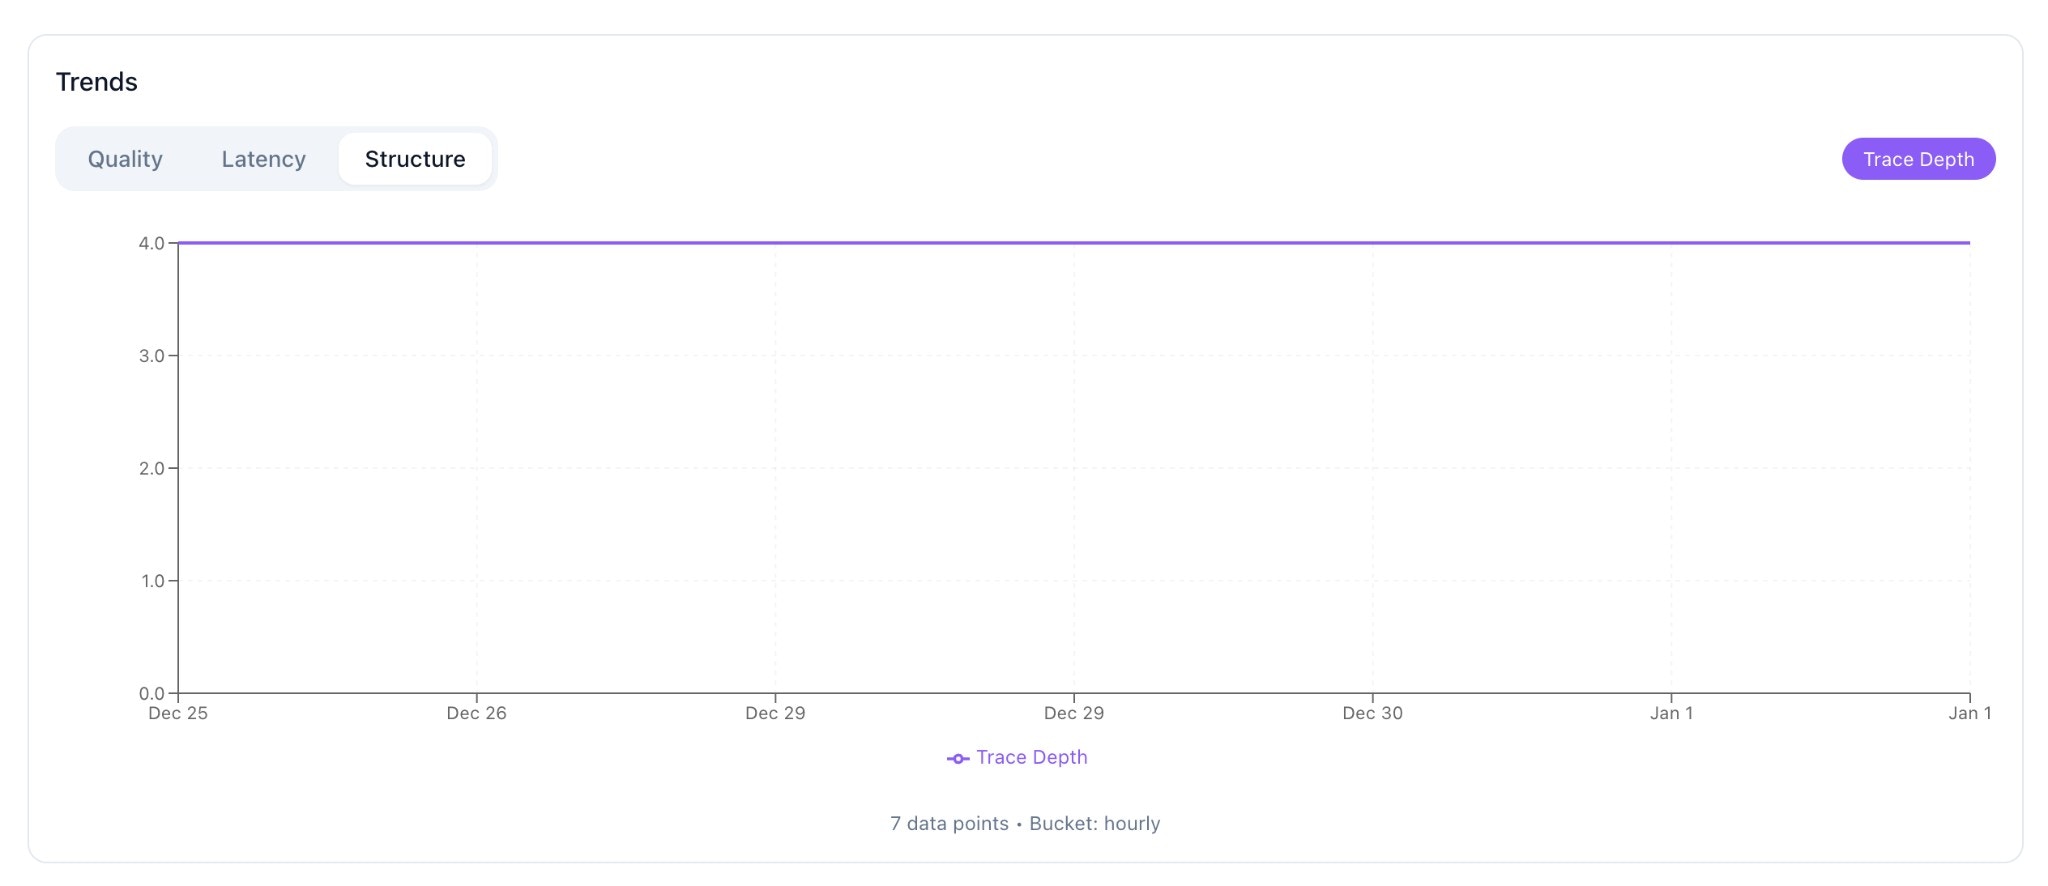
Structure Tab
Filtering
Filter your view using:- Environment: Select a specific env (prod, staging, dev)
- Period: 24 hours, 7 days, or 30 days
Cost Management
- Sampling keeps evaluation cost predictable. Start at
0.05and tune up if needed. - SDK batching minimizes request overhead (events are queued and sent in batches).
- Async mode (default) — logging never blocks your request path.
Estimated Costs
Privacy Considerations
- You control what you send. If passages are sensitive, include only what’s needed for evaluation.
- Use
metadatato tag records with access boundaries (e.g.,collection,tenant_id) for future filtering. - Consider truncating or summarizing very long passages.