

Logs Explorer
Drill into individual queries to understand exactly what happened: which documents were retrieved, how Seer scored them, and why quality metrics are what they are.Prerequisites: You have data flowing through Seer (see Quickstart) and understand Metrics.
Why Use Logs?
Aggregate dashboards show trends, but logs answer the hard questions:Two View Modes
The Logs page offers two ways to explore your data:Traces View (Default)
Best for multi-hop RAG and understanding end-to-end query flows.- Groups related spans by
trace_id - Shows the complete journey from query → retrieval → answer
- Displays final context metrics (what actually went to the LLM)
- Expandable tree visualization of span hierarchy
Records View
Best for individual record inspection and debugging specific retrievals.- Shows each evaluation as a single row
- Quick access to all metrics (recall, precision, F1, latency)
- Click any row to open the detail drawer
Filtering & Search
Find specific queries quickly using the filter toolbar:
Filters work across both Traces and Records views.
Traces View Deep Dive
Trace Table Columns
Metric Mode Toggle
Switch between two views of the Overall metric:- Final: Recall of the final context that was passed to the LLM
- Avg: Average recall across all spans in the trace
Expanding a Trace
Click any trace row to expand and see its spans in a tree structure:- Tree lines show parent-child relationships
- Span badges indicate type (retrieval, rerank, llm_call, etc.)
- Final context badge marks which span’s context was used for the answer
- Delta indicators show how each hop changed overall recall

Trace Detail Sidebar
Click the View button on any trace to open the full trace sidebar: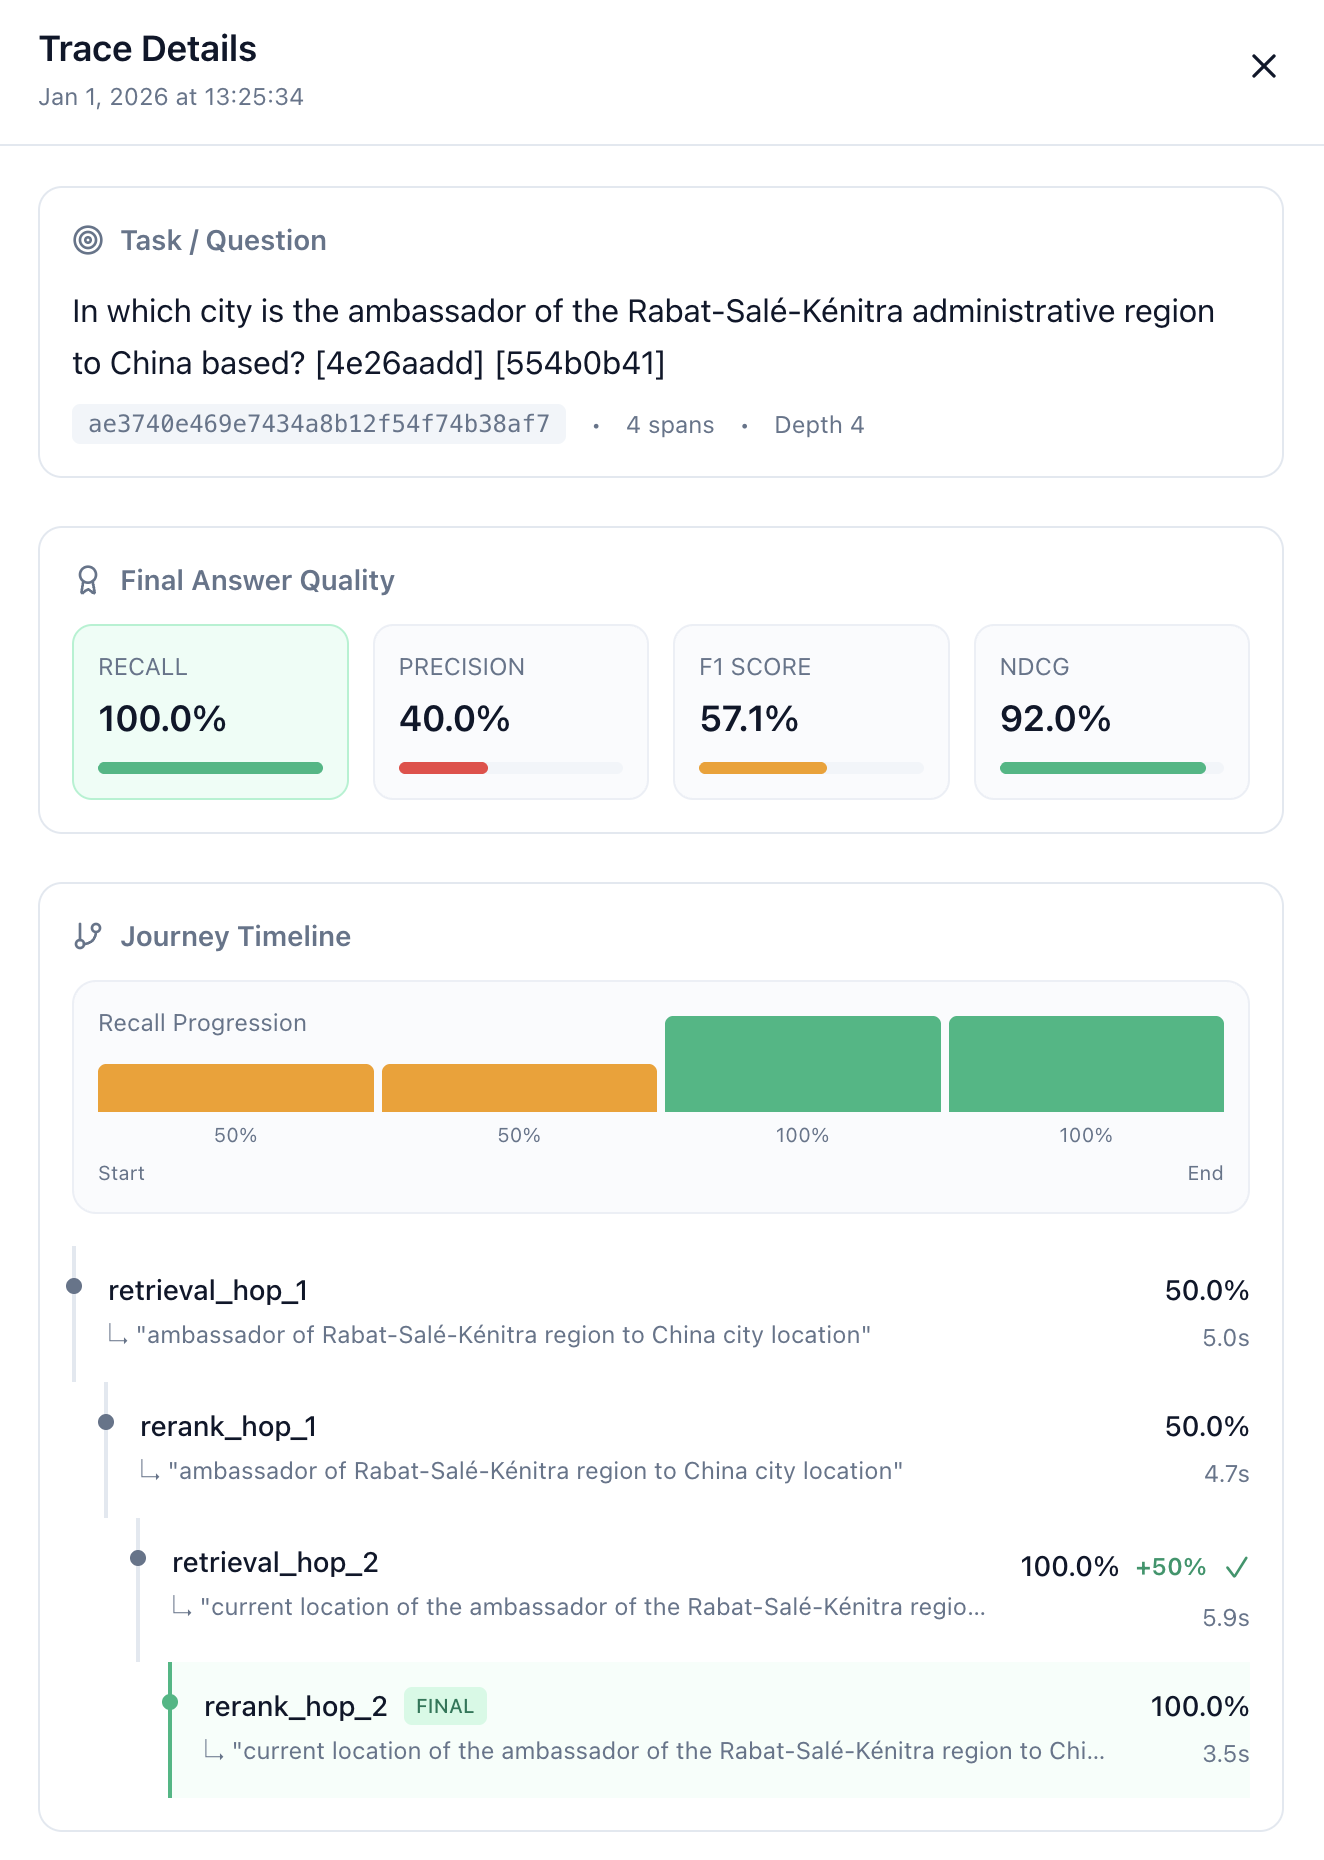
Records View Deep Dive
Records Table Columns
Sorting
Click any column header to sort:- First click: ascending
- Second click: descending
- Third click: return to default (newest first)
Record Detail Drawer
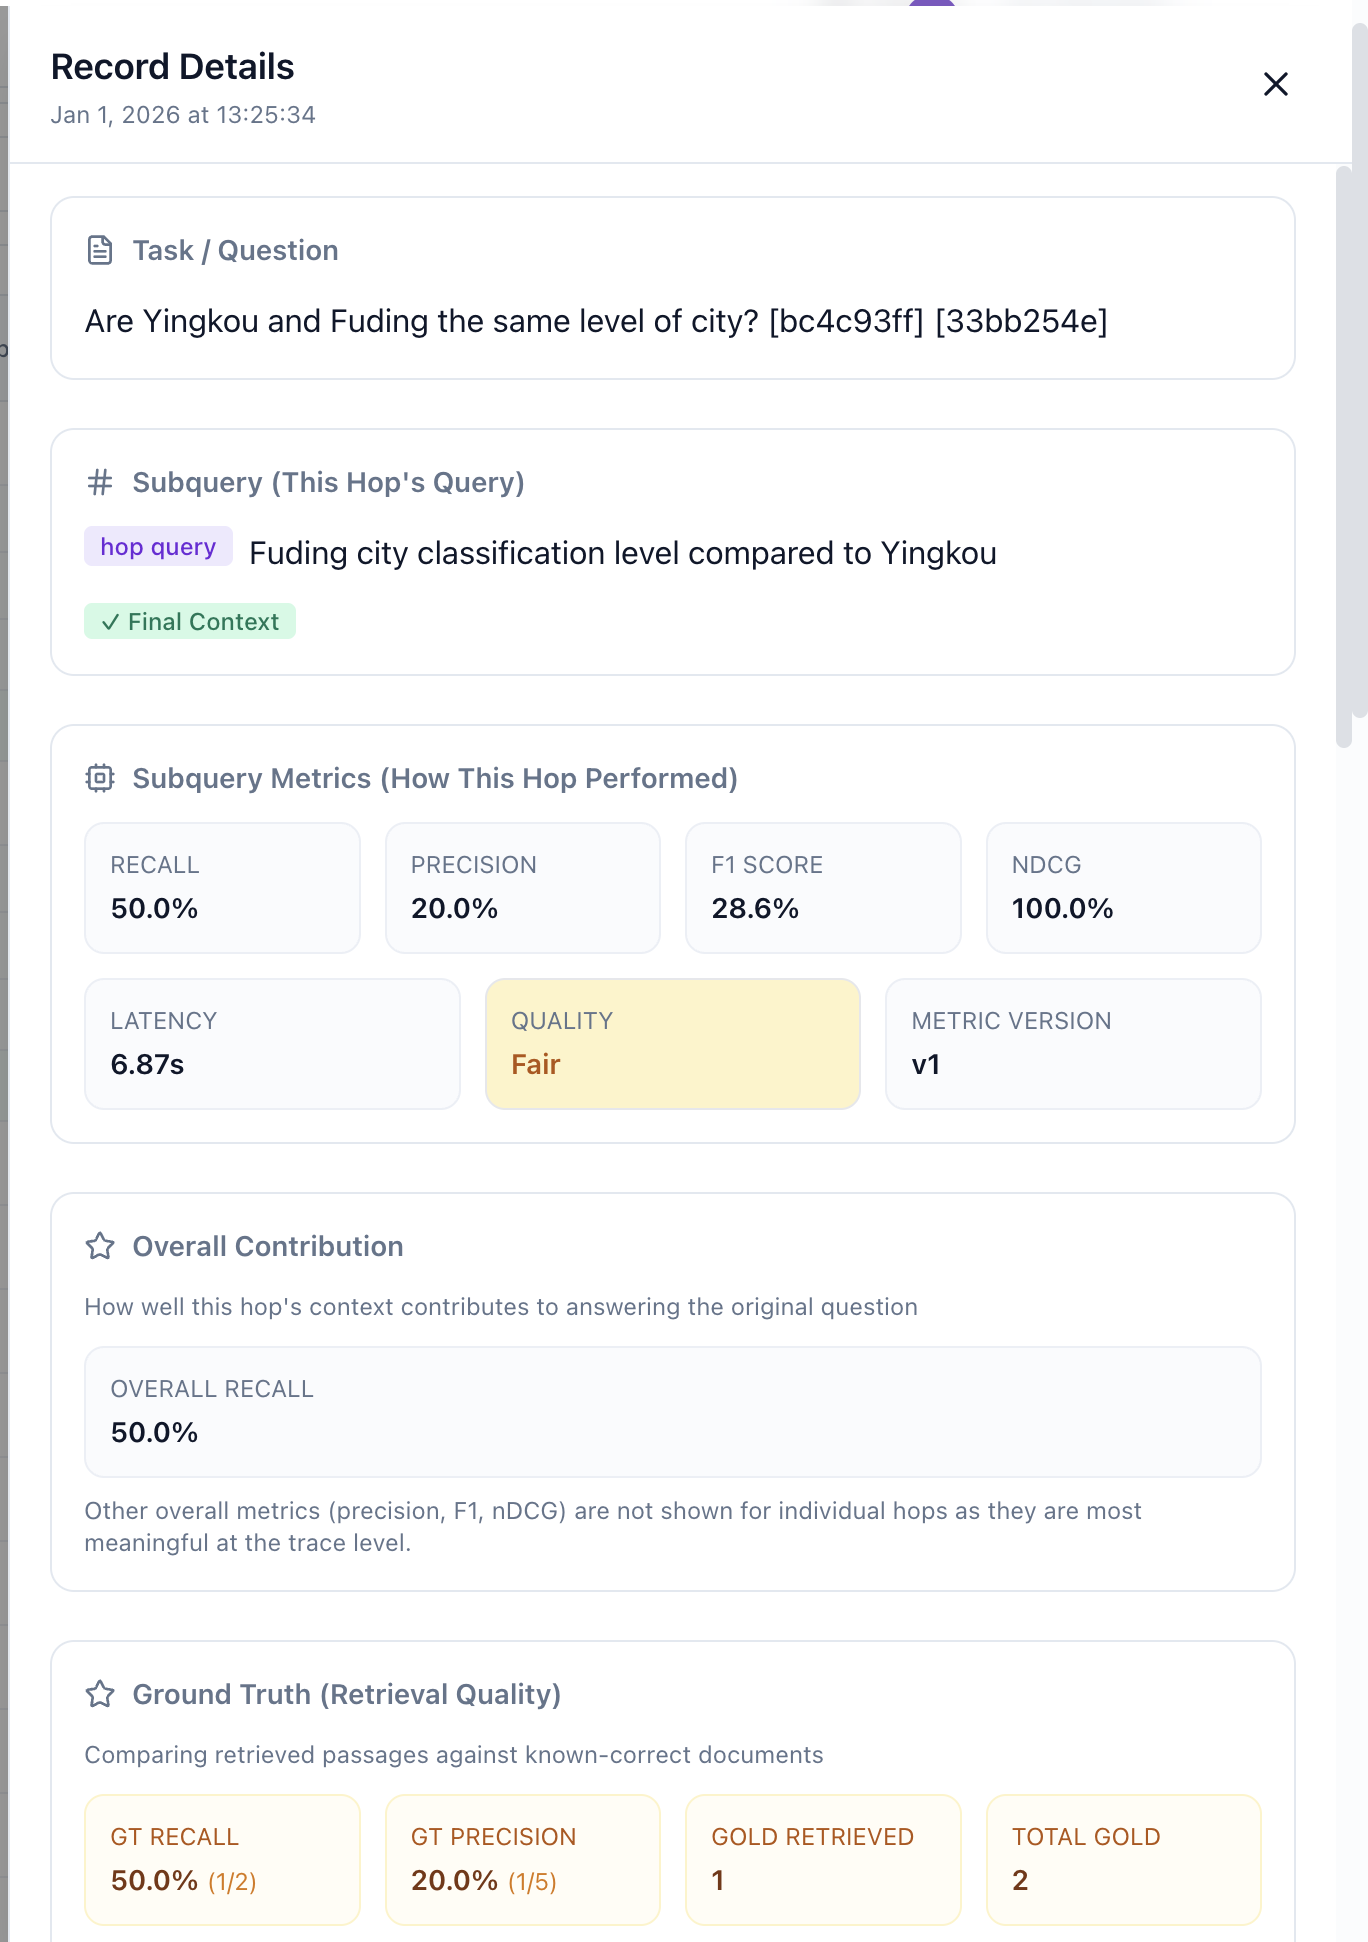
Click any record (in either view) to open the detail drawer:Sections
Passage Visualization
Each passage in the context shows:- Position and ID (e.g.,
#1 • ID: doc-123) - Gold badge if this doc is in ground truth
- Relevant badge if Seer marked it as supporting requirements
- Score from your retriever
- Full text of the passage
- Source if provided
- Green border: Relevant passage (correctly retrieved)
- Yellow border: Gold doc not marked relevant (missed)
- Gray border: Not relevant, not gold
Ground Truth Validation
When you log records withgold_doc_ids, the detail views show:
This is crucial for understanding retrieval quality independent of Seer’s evaluation.
Multi-Hop Retrieval Support
For traces with multiple spans, the Logs page shows the complete journey:In Traces View:
- Hop count badge on each trace (e.g., “3 hops”)
- Subquery column showing per-hop recall
- Depth indicator for complex trace structures
In Detail Views:
- Recall progression chart visualizing improvement across hops
- Delta indicators showing how each hop changed overall recall
- Effectiveness badges for hops that improved recall
- Final context marker showing which hop’s output was used
Example Journey
Working with Logs
Debugging a Low-Quality Query
- Filter by Quality: Poor
- Click a record to open the detail drawer
- Check Context Passages:
- Are relevant docs missing entirely?
- Are docs present but scored low?
- Are irrelevant docs ranked high?
- Check Ground Truth (if available):
- Which gold docs are missing?
- Check Seer Evaluation Output:
- Which requirements were not covered?
Investigating a Failed Trace
- Switch to Traces view
- Filter by Status: Failed
- Expand the trace to see which span failed
- Open the Record Detail for the failed span
- Check the Error Details section
Comparing Multi-Hop Performance
- In Traces view, toggle to Avg metric mode
- Sort by Overall ascending to find traces where avg is much lower than final
- These traces have inefficient early hops that later hops had to compensate for
Pagination
Both views support pagination:- Page size: 10, 25, 50, 100 records per page
- Navigation: Previous/Next with page number display
- URL persistence: Filters and page state are saved in the URL for sharing
Coming Soon
- Export: Download filtered logs as CSV/JSON
- Saved filters: Save common filter combinations
- Direct linking: Deep links from monitoring dashboard to filtered logs
- Annotations: Add tags and notes to specific records